Combining Life Extension Treatments: A Proposal for High-Throughput Testing in Rodents
Josh Mitteldorf1,2
1Washington University School of Medicine, St. Louis, MO, USA; E-mail: aging.advice@gmail.com2National Institute for Biological Sciences, Beijing, China
Received August 7, 2017
An experimental design is proposed for high-throughput testing of combined interventions that might increase life expectancy in rodents. There is a growing backlog of promising treatments that have never been tested in mammals, and known treatments have not been tested in combination. The dose-response curve is often nonlinear, as are the interactions among different therapies. Herein are proposed two experimental designs optimized for detecting high-value combinations. In Part I, numerical simulation is used to explore a protocol for testing different dosages of a single intervention. With reasonable and general biological assumptions about the dose-response curve, information is maximized when each animal receives a different dosage. In Part II, numerical simulation is used to explore a protocol for testing interactions among many combinations of treatments, once their individual dosages have been established. Combinations of three are identified as a sweet spot for statistics. To conserve resources, the protocol is designed to identify those outliers that lead to life extension greater than 50%, but not to offer detailed survival curves for any treatments. Every combination of three treatments from a universe of 15 total treatments is represented, with just three mice replicating each combination. Stepwise regression is used to infer information about the effects of individual treatments and all their pairwise interactions. Results are not quite as robust as for the dosage protocol in Part I, but if there is a combination that extends lifespan by more than 50%, it will be detected with 80% certainty. These two screening protocols offer the possibility of expediting the identification of treatment combinations that are most likely to have the largest effect, while controlling costs overall.
KEY WORDS: lifespan, life extension, combined treatments, high-throughput testing, rodentsDOI: 10.1134/S0006297917120057
Many individual treatments are known that modestly extend lifespan in rodents and, presumably, in humans, but the interactions among these treatments have barely been explored. It is far too optimistic to expect the benefits to add linearly. There is much redundancy among the mechanisms of action of the known interventions, so the underlying metabolic pathways would become saturated. Interference is the expected result for most combinations. But more rarely, we may find pairs of interactions that synergize; in other words, in a few cases we might expect that the mean life extension from two treatments A and B is equal to or even greater than the sum A + B of the benefits from the treatments separately. For example, rapamycin and metformin are reported to synergize [1], and angiotensin inhibitors work via a pathway distinct from either of these [2].
METHODS
Life extension treatments have usually been tested separately, one at a time, at a single dosage or a few dosages. This is a reductionist approach, appropriate for building a foundation of understanding at the metabolic level. However, if our goal is practical life extension in the near term, it may be more efficient to think as an inventor or engineer would. With high-throughput screening of candidate treatments, we might hope to identify the most promising combination of treatments and the most effective dosages. In this way, we sacrifice understanding, but maximize our probability of identifying a protocol of extraordinary effectiveness, given limited time and resources.
There is a growing backlog of promising ideas that have yet to be tested in mammals. In addition, there are many effective treatments, already identified and tested singly, but not in combination.
Herein, I ask: What would be an appropriate experimental and statistical protocol for testing new treatments and combinations of known treatments, if our resources are limited and our goal is to identify the outliers that have extraordinary effectiveness? As examples, I have explored two methodologies in numerical simulation. In one, a single treatment is tested in a range of dosage domains, and the results are fitted to a parametrized dose-response template. In the second, combinations of three treatments are tested, each on a small number of test animals, and the results are deconvoluted using multilinear regression.
For both these proposals, real laboratory data are not yet available, so I have analyzed computer-generated data to evaluate the effectiveness of the proposed methodology.
RESULTS AND DISCUSSION
I. Studies of a single treatment at various dosages. The model begins with 80 (simulated) mice, each receiving a different dosage of a trial drug. Dosages range over a factor of 100, and are equally spaced on a logarithmic scale. Sample data are randomly generated, based on assumptions about the dose-response curve that are varied in each simulated case. Then the data are analyzed, and an attempt is made to recover the input dose-response curve based on the random output for 80 mice.
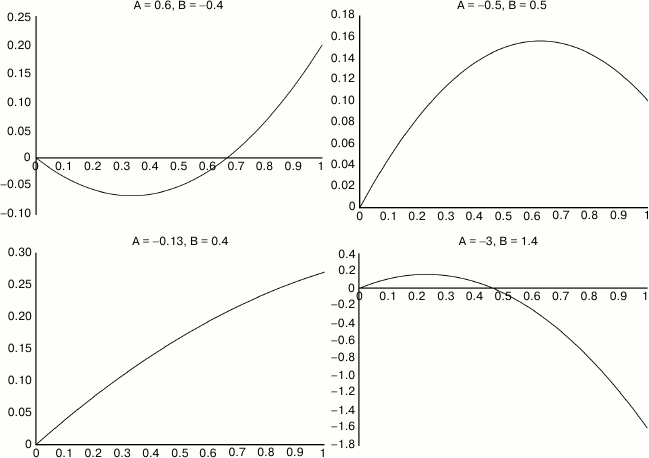
1. Mean lifespan for each mouse is computed from a quadratic dependence on dosage, ln(LS) = C + Bx – Ax2, where x is dosage and A, B, and C are parameters to be derived from regression.
2. Actual lifespan of each individual mouse is generated from a Gaussian distribution with a mean computed as above and a standard deviation equal to 20% of the mean. The 20% value is typical of the standard deviations of lifespans of mice under identical treatment.
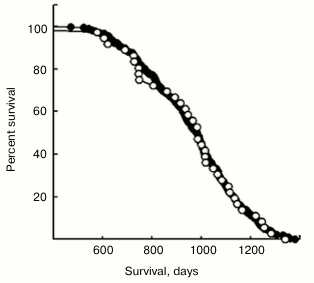
3. If the base lifespan for no treatment is well-established ahead of time, then the parameter C in the quadratic formula is known, and similar accuracy can be obtained with only 40 mice, using a two-parameter model. (See Figs. 1 and 2 for illustration.)
Fig. 1. From Spindler et al. (2013) [3].
Fig. 2. Sample illustrating the variety of different curve shapes that can derive from various values of two parameters A and B. Most commonly, we expect a linear increase in lifespan from small doses, and a curve that levels off with saturation and then declines with toxicity. X axis is dosage in arbitrary units. Y axis is the natural log of lifespan compared to untreated.
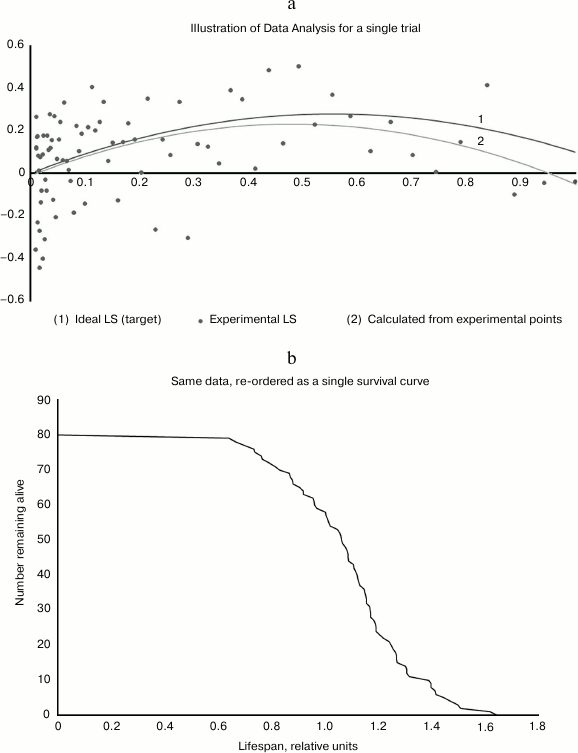
Results for each trial consist of ages at death for 80 mice, each of which received a different dosage. For analysis, the logarithms of the 80 lifespans are subject to bi-linear regression against dosage x and x2. This procedure aims to recover the original parameters A, B, and C, and I call the corresponding regression parameters A′, B′, and C′. Each such trial and analysis was repeated 10,000 times, simulating 10,000 replicates of the same experiment. The 10,000 runs constitute one “case”. I repeated the analysis for 100 cases, systematically exploring the 2-dimensional parameter space of A and B that determine the assumed dose-response curve (C is arbitrary). (See Fig. 3, a and b.)
Fig. 3. a) Illustrative analysis of a single case. Input is the upper curve 1, parametrized by the two constants A and B. Output is the 80 dots, representing mouse lifespans in response to 80 different dosages between 0.01 and 1.0. Dots are clustered to the left because the distribution is logarithmic. Analysis of these 80 data points produces the reconstructed constants A′ and B′, from which the lower curve 2 is drawn. The fact that a reasonable approximation can be extracted from such noisy data suggests that the data are well-used, and not much statistical power is being wasted. b) This chart was generated from the same data as the above, with the 80 mice reordered by lifespan. It offers the familiar shape that reassures us that the experiment was well-done. Note however that each of the mice in this cohort received a different dosage, and this tends to spread out the X axis and also make it a little bumpier than it would be otherwise.
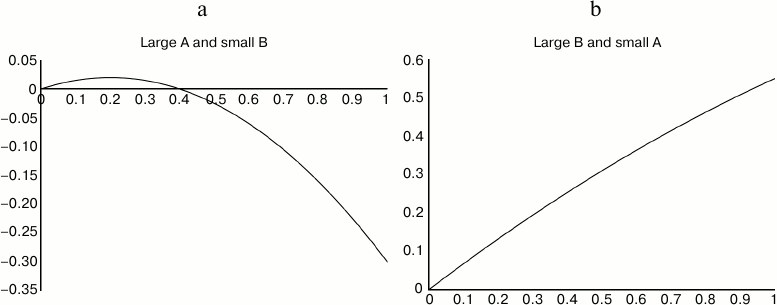
Overall, the computed values of life extension B′x – A′x2 tracked the input values of Bx – Ax2 well, with a correlation r2 = 0.82. B′ tracked B well, and A′ tracked A less well. The life extension at optimal dose was within 1% of the input values for an average 85% of all trials, and within 5% for 95% of all trials. The slope B′ was within 1% of the target coefficient B for 80% of all trials, and within 5% for 82% of trials. (Where the slope B′ strayed from B, usually A′ varied in parallel, so that the errors mutually mitigated one another.) (See Figs. 4 and 5.)
Fig. 4. The methodology described here works very well for dose–-response curves like the one on right, with small curvature, and fairly well for curves like the one at left.
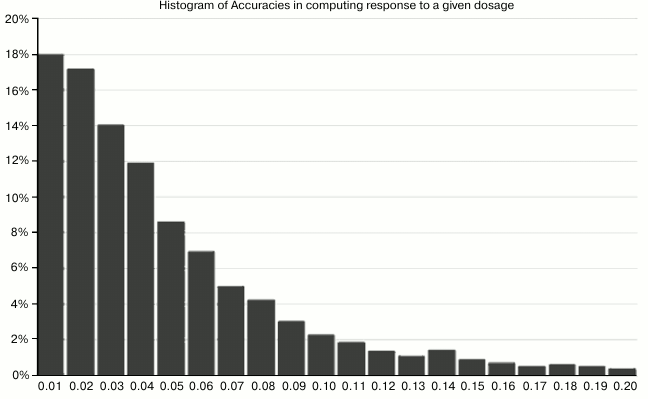
Fig. 5. This chart shows the accuracy with which the computed parameters A′, B′, C′ could reproduce the input results for given (randomly-generated) dosages. For example, the leftmost bar means that in 18% of cases, the methodology reproduced the “right answer” for expected lifespan within 1%. The leftmost five bars together mean that in 70% of cases, the accuracy was within 5%.
II. Studies of treatment combinations using all possible triples. Begin with 15 proven or promising treatments. There are C(15,2) = 105 pairs that may potentially interact. It will be efficient to combine treatments in 3′s rather than 2′s, then use regression analysis to deduce the effects of individual treatments and also their pair interactions. (Testing less than three at a time requires more mice, and also loses information about possible triple synergies. Testing more than three at a time entails numerical difficulties; inversion of larger matrices is hypersensitive to sampling errors in the data.)
There are C(15,3) = 455 distinct triple combinations. Each triple is replicated in three mice, for a total of 1365 mice. Each treatment, then, is present in 3·C(14,2) = 273 mice, and each pair of treatments is present in 3·(15 – 2) = 39 mice. Thirty-nine replicates are a sufficiently large sample to extract information with confidence about each pair interaction. This is the mathematical economy of scale that makes this size study a sweet spot for testing the methodology.
Critical assumptions:
– pairwise but not 3-way interactions were not explicitly considered in modeling this simulation. (Preliminary analysis suggests that including 3-way interactions will not change reliability of results.);
– most pairs are assumed to interact negatively, but the simulation allows for some positive synergies (and seeks to identify these);
– for each treatment, only a single dosage is tested;
– parameters were chosen randomly such that there was always a combination of 3 that offered life extension greater than 50%.
Recipe for analysis:
– 105 trivariate regressions, one for each pair of treatments. For example, the first regression would have three independent variables: A, B, and AxB, where AxB is a synergy term;
– for each treatment, exclude the three strongest interactions, as determined in step 1, and perform all 15 single variable regressions. That leaves 11 other cages (33 other mice);
– use the single regression coefficients from (step 2) and the triple regression coefficients from (step 1) to predict a lifespan for each combination of three treatments;
– construct a weighted average of the result from (step 3) with the actual average lifespan of the three mice that received just those three treatments. Optimum weights are about 85% for the prediction and 15% for the actual average;
– compare these predicted lifespans with the “actual” average lifespans that were assumed in generating the model.
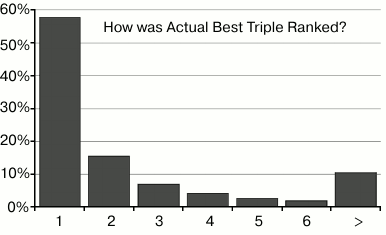
I conducted 20,000 trials, a single replicate of each trial. The “actual” best combination of three treatments was selected based on lifespan data 58% of the time; 81% of the time the best combination was among the top three, and 90% of the time it was in the top six (out of 455). (See Figs. 6-8.)
Fig. 6. This chart shows that the best combination in the input data was correctly ranked as #1, 58% of the time. The second bar shows that it was ranked #2, 16% of the time, etc.
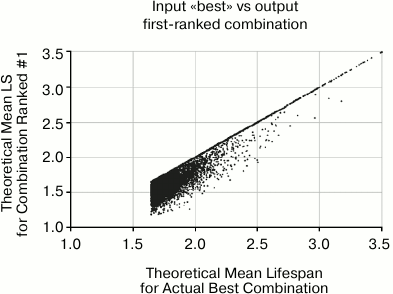
Fig. 7. This scatter plot shows the actual mean lifespan of the combination that is selected by the algorithm as #1 based on the data, versus the input mean lifespan on the X axis. The concentration of points along the diagonal represents the 58% of cases in which the selected #1 is correctly identified as the combination with longest mean lifespan. The wall at the top comes from the fact that the algorithm cannot do better than identifying #1. The wall on the left was imposed by filtering input parameters such that there was always at least one combination that offered mean life extension of 67%.
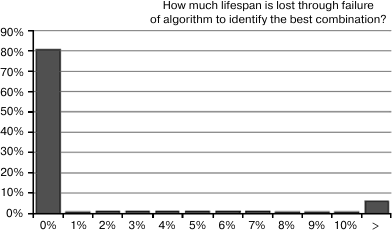
Fig. 8. This is a histogram showing how much life extension is “left on the table” as a result of misidentification of the best 3-way combination because random variation in life expectancy fooled the identification algorithm. The left-most bar shows that the algorithm works optimally in 81% cases, in that the best combination is identified among the top 3. To the right, the probabilities do not descend as rapidly as we might like, and there remains a 6% probability of missing the best combination by more than 10%.
If our interest is in identifying the most effective longevity treatments for potential human use, much more information can be extracted from each rodent than in customary lifespan protocols, which are optimized for basic scientific understanding. The two protocols analyzed in this work are illustrative, and are not optimized; nevertheless, they point the way toward more efficient ways to use our time and our lab resources.
In single-treatment studies, information is maximized if every individual animal is given a different dosage. To cover a wide range of dosages, a logarithmic distribution of dosages is useful, and in lieu of zero-dose control animals, the distribution may be anchored at the low end with dosages an order of magnitude below the expected threshold of effectiveness.
In multi-treatment studies, three seems to be a manageable number of treatments to combine in each animal. Pairwise and three-way interactions can be inferred by regression analysis. These results suggest that multiplexing with 1000 to 2000 mice in a single study offers significant economies of scale compared to combinations of smaller studies.
REFERENCES
1.Singh, A. K., Garg, G., Singh, S., and Rizvi, S. I.
(2017) Synergistic effect of rapamycin and metformin against
age-dependent oxidative stress in rat erythrocyte, Rejuv. Res.,
doi: 10.1089/rej.2017.1916.
2.Blagosklonny, M. V. (2017) From rapalogs to
anti-aging formula, Oncotarget, 8, 35492-35507.
3.Spindler, S. R., Mote, P. L., Flegal, J. M., and
Teter, B. (2013) Influence on longevity of blueberry, cinnamon, green
and black tea, pomegranate, sesame, curcumin, morin, pycnogenol,
quercetin, and taxifolin fed iso-calorically to long-lived, F1 hybrid
mice, Rejuv. Res., 16, 143-151.
