REVIEW: Detection of Intermolecular Interactions Based on Surface Plasmon Resonance Registration
D. V. Sotnikov, A. V. Zherdev, and B. B. Dzantiev*
Bach Institute of Biochemistry, Research Center of Biotechnology, Russian Academy of Sciences, 119071 Moscow, Russia; E-mail: sotnikov-d-i@mail.ru; zherdev@inbi.ras.ru; dzantiev@inbi.ras.ru* To whom correspondence should be addressed.
Received September 16, 2015
Methods for registration of intermolecular interactions based on the phenomenon of surface plasmon resonance (SPR) have become one of the most efficient tools to solve fundamental and applied problems of analytical biochemistry. Nevertheless, capabilities of these methods are often insufficient to detect low concentrations of analytes or to screen large numbers of objects. That is why considerable efforts are directed at enhancing the sensitivity and efficiency of SPR-based measurements. This review describes the basic principles of the detection of intermolecular interactions using this method, provides a comparison of various types of SPR detectors, and classifies modern approaches to enhance sensitivity and efficiency of measurements.
KEY WORDS: surface plasmon resonance, registration of intermolecular interactions, enhancement of analytical signal, multiparametric assayDOI: 10.1134/S0006297915130131
Surface plasmon resonance (SPR) has been used in biochemistry for over three decades. Formation of intermolecular complexes of a two-phase interface is followed by a change in the refraction index of one of the phases, which leads to SPR parameter modulation as registered by the detector [1]. Actually, all SPR detectors are refractometers. Many sensor systems have been developed on the basis of SPR; they have become effective tools both for researching intermolecular interactions and resolving practical analytical tasks.
The SPR-based methods attract researchers first because of the possibility to register interactions without using markers, high sensitivity, precision, and reproducibility of results. In the course of intermolecular complex formation and dissociation, the mass transfer processes between the media and the sensory surface are registered in the form of sensor signal time dependence (sensorgrams). Based on these dependences, one can calculate the kinetic and equilibrium constants of complex formation reaction. Data of sensorgrams changes versus temperature, allow calculating reaction thermodynamic characteristics: changes of Gibbs free energy, enthalpy, and entropy [2].
SPR-detection technology is of universal character and enables registration of interactions of both low molecular weight objects and macromolecules, their agglomerates, viruses, and even whole cells. It has stipulated intensive use of the method of in fundamental research, medicine, environmental monitoring, foodstuff safety control, and other fields as well [2, 3]. Recently, significant efforts have been directed at mastering the SPR method: enhancing detection sensitivity [4] and creating systems for simultaneous registration of multiple interactions [5]. Commercial implementation of these developments will provide even wider use of SPR methods.
This review briefly describes the principle of SPR analysis and considers the most common methods of SPR initiation and various detector types. Special attention is paid to new solutions for high sensitivity and efficient SPR analysis.
OPERATING PRINCIPLE OF SPR SENSORS
Plasmons are pseudo-particles representing electron gas quantum fluctuations in the conducting material. Resonant excitation of these vibrations by electromagnetic waves in the thin layer of the conducting material, placed between the two media with different refraction index, is named “surface plasmon resonance” [1].
In most cases, to excite SPR, a system is used that consists of transparent material with high refraction index (for instance, silica [6]) and a thin gold film applied on its surface. The opposite side of the film is contacting the analyzed medium. Preferred use of gold in such systems is stipulated by high chemical stability of the metal [7].
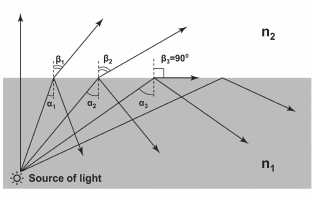
Generation of SPR is possible when complying with conditions of total internal reflection [1]. The total reflection phenomenon is based on the effect that when light is passing from a more dense optical medium to a less dense one, the refracted beam deviates from the normal media interface (the angle of refraction is higher than the angle of incidence). If the angle of incidence is increased so much that the angle of refraction exceeds 90°, then the light will not be able to penetrate into the medium with lower refraction index, and most of the light energy (at low extinction) will reflect from the media interface (Fig. 1).
Fig. 1. Effect of total internal reflection. n1 and n2 – refraction indices of the two media (n1 > n2); αi – angles of incidence; βi – angles of refraction. Angles >α3 are called angles of total internal reflection (in this particular range of angles, refracted angles do not exist).
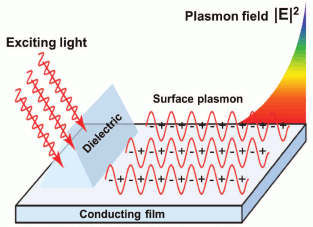
The electric field of photons will penetrate into less dense optical substrate, but only by the distance of the wavelength of light. If in this case there is a layer of conducting material of thickness less than the length of the light wave on the interface, then electromagnetic field penetrating the layer will be generating vibrations of free electrons (Fig. 2). To achieve effective excitation of these vibrations, the light frequency must be less than the natural frequency of electron vibration (plasma frequency) [8, 9]. That is why when exciting SPR in metal films, light of the visible spectrum and near infrared spectrum range is used, because the plasma frequency of most metals is in UV range of the spectrum.
Fig. 2. Excitation of surface plasmon on conducting film.
Resonance absorption of light energy by electron vibrations occurs when a surface plasmon pulse vector is equal to the projection of the photon pulse vector on the substrate interface [10]. Parameters of the first of these vectors depend upon the conductor properties and refraction indices of boundary phases, while parameters of the second vector depend upon the light frequency and the angle of incidence. If the resonance conditions are observed, then the intensity of reflected light drastically decreases due to transformation of part of the light wave energy into plasmon energy.
Minimum changes of refraction index in the interface area caused by a change in medium composition lead to changes of SPR conditions. This fact allows, by registering the parameters of a reflected wave, to detect in real time formations of complexes on the substrate interface. Stimulating light resonance frequency at a fixed angle of beam incidence, or resonance angle of beam incidence at fixed frequency, can act as registered parameters, as well as light magnitude or phase. The first two types of SPR detection are also known as surface plasmon spectroscopy with frequency and angle spectra, respectively [11].
Another condition for effective plasmon excitation is related to exciting light polarization. Vibration of the electrons is mostly excited by action of the electric component of an electromagnetic wave. That is why the strongest interaction with the electrons in the conductive film is provided by a plane-polarized wave with electric field vector parallel to the incident plane. The vector of the magnetic field in this case is vibrating in parallel to the interface. A wave of this kind is called p-polarized, π-polarized, H-type wave, or TM-wave (Transverse Magnetic). In contrast, the s-polarized wave has the vector of electric field E perpendicular to the incident plane. The s-polarized wave is also called σ-polarized, sagittal polarized, wave of E-type, or TE-wave (Transverse Electric). Prefixes p- and s- were introduced from German words parallel and senkrecht (parallel and perpendicular).
As far as an s-polarized wave interacts with plasmon, weakly, p-polarized light is mostly used in SPR systems [12]. An exception is SPR detectors with phase modulation, where phase difference of p- and s-polarized waves after interaction with the plasmon are registered [13].
The SPR sensitivity to change of refraction index depends upon the magnitude of plasmon wave field, which decreases exponentially when withdrawing from the interface. That is why SPR is most sensitive to changes directly at the media interface. To describe the thickness of a sensible layer, the term of field penetration depth is used – the distance from the surface at which field magnitude decreases by e (base of the natural logarithm) once. This parameter is increasing with increase of wavelength. For instance, for the gold system, dielectric with refraction index of 1.32, we can increase the field penetration depth from 100 to 600 nm by varying agitating light wavelength from 600 to 1000 nm [14].
SPR EXCITATION METHODS
As stated above, plasmon resonant excitation occurs when the surface plasmon pulse vector is equal to the projection of the photon pulse vector on the medium interface (sometimes this requirement is formulated as wave vector equality). However, usually a plasmon pulse is higher than those of photons are [9]. That is why special facilities are used for SPR generation (coupling devices), which increase photon pulse. The exception is SPR excitation in metal particles of nanometer size – no additional facilities are required. Prisms, waveguides, and diffraction lattices are used as the coupling devices, less often – other devices, like photon crystals [14, 15]. Let us review the most common methods of SPR excitation:
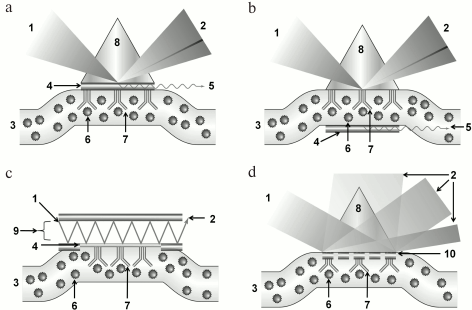
SPR with prism coupling devices. In the pioneering works of Otto [16] and Kretschmann [17], SPR was stimulated/triggered by light passing through prisms of dielectric material with high refractive index. In Kretschmann’s scheme, the light exiting the prism falls on a metal film applied on the lower prism face, and being reflected by it proceeds to detector. The opposite face of the metal film contacts the analyzed substrate (Fig. 3a). In Otto’s construct, the light is reflected by the interface of the prism and analyzed substrate, while the metal layer is placed close to this interface (Fig. 3b). Mostly prism-type coupling devices are used in SPR analysis, with Kretschmann geometry, which is due to their simplicity and high efficiency of plasmons stimulation [18]. Prism-type coupling devices can be combined with all types of SPR detectors: ones measuring resonant angle, resonant wavelength, amplitude, or phase of the reflected light.
Fig. 3. Schemes of SPR sensors with various types of coupling devices: a) with prism of dielectric in Krechmann’s configuration; b) with prism of dielectric in Otto’s configuration; c) with waveguide; d) with diffraction lattice. 1) Exciting light; 2) reflected light; 3) analyzed medium; 4) metal film; 5) surface plasmon; 6) analyte; 7) receptor; 8) prism of dielectric with high refraction index; 9) waveguide; 10) diffraction lattice.
SPR with waveguide coupling devices. Due to the total internal reflection effect, the light can spread inside an optical waveguide – the transparent channel made of material with high refraction index. If the metal film is applied on the surface of this channel, then the light wave field can excite the surface plasmon on the outer surface of the films (Fig. 3c). Most often, these SPR systems are realized as fiber optic channels with metal coating at the sensor section [19]. SPR detectors in systems with waveguide coupling devices can operate in the mode of phase, frequency, or amplitude of modulation, but not angle modulation [20].
SPR with diffraction lattice. Instead of solid metal coatings, for plasmon stimulation it is possible to use a diffraction lattice with lattice dimensions less than the light wavelength. Intermolecular interaction registration in devices of this type is provided by measuring diffracted light parameters and comparing characteristics of the beams with different diffraction orders of magnitude. SPR sensors with diffraction lattice are very diverse: they can operate in either the transmission mode or the reflection mode, while the stimulated light can fall directly on the sensor face or on the opposite face. Similar to SPR sensors with prism-type coupling devices, SPR sensors with diffraction lattice can combine all types of detectors [21-23]. Figure 3d presents an example of an SPR sensor with diffraction lattice in reflection mode.
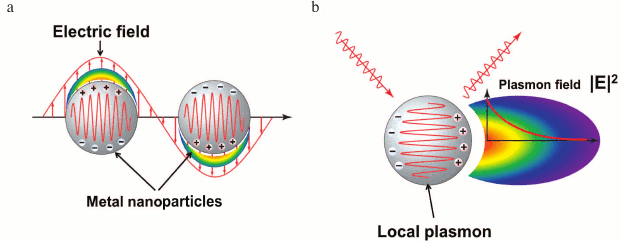
Local SPR. Of special consideration is the excitation of the surface plasmons inside metal particles for sizes less than the stimulated light wavelength. Plasmons of this kind represent quanta of collective electron vibrations, similar to harmonic oscillator vibrations, in relation to positively charged nuclei (Fig. 4). In contrast to plasmons, the vibrations do not spread in the extended structures, and that is why their resonant excitation was called local surface plasmon resonance (LSPR).
The modeling of LSPR, using Mie theory of light scattering, reveals [24] that for its generations no coupling devices are needed. Change of medium composition around nanoparticles shifts the resonant frequency of electron oscillations and the peak of extinction in the spectrum of light passing through the solution of nanoparticles. This shift is used for monitoring complex formation processes on the surface of nanoparticles.
Fig. 4. LSPR excitation by electric field (a) and field intensity distribution around a nanoparticle with excited plasmon (b).
COMPARATIVE CHARACTERISTIC OF SPR DETECTORS
Classification of SPR detectors is based on the light wave parameters being measured by the detectors. There are four types of registering devices distinguished by measuring reflection angle, frequency, intensity, and phase shift of light.
The main characteristics of SPR detectors are as follows: sensitivity, resolution, detection limit, and dynamic range [14].
The sensitivity of an SPR detector is a ratio of sensor signal change to change of the refraction index [25]. The refraction index is measured in RIU (refractive index unit), while detector signal can be the resonant angle, the resonant wavelength, intensity, or phase shift of the reflected light. That is why for two different SPR detectors the units of sensitivity measurements can be different [4].
The resolution of an SPR detector is a ratio of noise standard deviation to the sensitivity. In contrast to sensitivity, the resolution characteristics for all types of SPR detectors are measured in the same units – RIU [13, 25]. Hence, as far as at the same noise level exists, increase of sensor acuity leads to reduction in resolution, sensors with lower resolution considered as being more sensitive.
The lower limit of detection is the analyte concentration that causes change of sensor signal equal to three standard deviations of the background signal [25]. It is often called just the limit of detection.
Dynamic range is the range of values where the parameter being defined can be reliably measured [26, 27]. One should distinguish the dynamic range from the working range. The latter is the range of values where the parameter being defined can be measured with pre-set precision [27].
In the table, various types of SPR detectors are compared by analytic characteristics. As we see, by reduction of resolution characteristics the SPR detectors are placed as follows: 1) intensity measurement; 2) resonant wavelength measurement; 3) resonant reflection angle measurement; 4) phase shift measurement.
By reduction of the dynamic range, the sensors are placed as follows: 1) resonant wavelength measurement; 2) resonant reflection angle measurement; 3) intensity measurement; 4) phase shift measurement.
Analytic parameters of various types of the SPR detectors
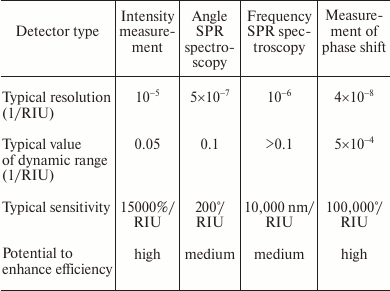
Due to simplicity, high sensitivity, and wide working range, detectors with resonant angle measurement are now most widely used [13, 14]. These detectors based on phase shift measurement and feature the best resolution characteristics, but their main drawback is the narrow range of measured values [13].
There are methods that allow widening of the dynamic range of phase shift in phase shift detectors up to 0.06 RIU at resolution of 2.2·10–7 RIU [4, 28, 29]. As a result, their dynamic range becomes comparable with the dynamic range of detectors with intensity measurement, while their resolution characteristics still are in excess of resolution characteristics of most detectors.
One of the most important directions in developing SPR sensors is the increase of sensor efficiency. Most efficient are the systems of SPR imaging (see below) comprising mostly detectors registering intensity modulation or phase shifts of the reflected light. SPR imaging with angle and frequency modulation are also possible, but devices of this type are much more complex and are less marketable as competitors [13, 14].
As we see, the choice of a particular detector type is determined by specifics of the task: for determination of analytes in low concentrations, phase shift detectors or angle SPR spectroscopy are preferable; for wide concentration range detection – frequency or angle SPR spectroscopy; for high efficient analysis – measurement of the intensity or the reflected light shift.
SCHEMES FOR ANALYSIS
The first stage of SPR analysis is the modification of sensory surface to provide it with ability to bind the analyte in a specific way. For this purpose, the following receptor molecules on the sensory surface are immobilized: antibodies, peptides, nucleic acids, etc. [30-33]. Receptor molecule binding with the sensory surface can be conducted using various covalent [34-39] and noncovalent [40-45] methods of immobilization.
After surface modification, reactions of specific interaction of ligand–receptor are conducted on the surface. Depending upon the composition of the complexes generated on the sensory surface and the component binding sequence, four main schemes of conducting SPR analysis are distinguished [5].
Change of refraction index close to the sensory surface increases with mass increase of the molecules bound to the surface. That is why, in case analyzed objects are of larger mass (>5 kDa), their binding with the sensory surface leads to sufficient change of refraction index in the area close to the interface. This format of analysis is called direct.
If the analyte has several potential sites of binding with the receptor molecules, then after complex formation it retains free valences. Usually, the same is also valid for large objects. Free valences can generate complexes with the receptor in solution, which leads to additional signal increase by means of enhancing the mass connected to the surface. As a result, the analyte in the complex is included between two or more receptor molecules. This format is called “sandwich”, and it is used for more sensitive detection.
Low molecular weight compounds, when binding, change refraction index, and that is why they are hard to detect by direct SPR method. In those cases, competitive or inhibiting analysis is used instead [14]. In the first case, the analyte conjugates with a carrier of larger size, and the receptor is immobilized at the sensor surface. Conjugated and free analytes are mixed, and in the mixture they compete for binding to the receptor. In the second case, a fixed concentration of the receptor is added to the analyzed solution, while on the surface the analyte or its conjugate is immobilized. If free analyte is present in an analyzed solution, it binds with the receptor, preventing receptor interaction with the modified surface. Inhibiting analysis is a version of competitive analysis, but often it is separated in a special format.
Note, that in both direct and “sandwich” analysis, there is a direct dependence of detected signal on analyte concentration observed, while in competitive and inhibiting analysis – the reverse dependence occurs.
ENHANCING SENSITIVITY OF SPR BIOSENSORS
Low sensitivity of SPR sensors in determination low molecular weight compounds represents a significant limitation of sensors. The limit of detection for most commercial SPR sensors corresponds to the surface density of chip-connected protein analyte of approximately 1 pg/mm2. This very degree of surface occupation usually corresponds to one unit of signal change, measured in resonant units (RU) [1].
However, many tasks require detecting low molecular weight compounds in extremely low concentrations. In these cases, it is necessary to find additional methods of increasing sensitivity, which can require sufficient modification of the sensor design or inserting additional markers.
In this section, we will be compare SPR sensors by their resolution parameter, because in contrast to sensitivity, the resolution of various types of SPR sensors is measured in the same units – RIU (see section “Comparative Characteristic of the SPR Detectors”). However, because reducing sensor resolution leads to increase in its sensitivity and reduction of limit of detection [4], then for the purpose of simplicity we will be using the expression “methods of enhancing sensitivity”.
Methods of Phase Shift Measuring
As already noted, the most sensitive of all SPR sensors are the systems measuring the phase shift generated by the interaction of the beam with the surface plasmons. That is why the use of this technique itself can be considered as a method to increase sensitivity. The main difficulty in using this approach is that, in contrast to other parameters registered by SPR sensors, the light phase cannot be measured directly due to high frequency of light (level of 1014 Hz for visible light). Therefore, the phase shift caused by interaction with the surface plasmon is measured indirectly, using interference phenomenon. Below we will review the main approaches of these measurements.
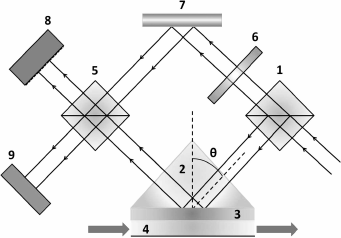
Analysis of the interference pattern. In 1997, Kabashin and Nikitin proposed a device based on a Mach–Zehnder interferometer for analyzing the interference pattern to determine the phase shift in SPR [46, 47]. The method is based on separating an incoming laser beam into two components: the signal arm and the reference arm (Fig. 5). The signal arm is directed into the cell for SPR, where the p-polarized beam component undergoes phase shift, while the reference arm is reflected from the mirror without any change. Then both beams are directed at the detector, where the beams interfere with formation of a specific pattern; based on pattern analysis, the phase shift is calculated. The experiment revealed that exchange of Ar and N2 gases in the SPR cell leads to reflected light phase shift 0.6-0.7 π, which corresponds to detection limit of 4·10–8 RIU.
Fig. 5. Basic scheme of SPR interferometer: 1, 5) beam splitting cubes; 2) prisms; 3) gold film; 4) gas chamber; 6) absorption filter; 7) mirror; 8) CCD-matrix; 9) wide-aperture diode (scheme prepared with considerations of [46]).
In later studies, a number of SPR sensors were described that use alternative interferometers (Michelson interferometer [48], Fabry–Perot interferometer [49], etc.), birefringence crystals [50, 51], wave plates [52], Wollaston prisms [53], and other devices.
Ellipsometry. Since the s- and p-components of the light wave interact with surface plasmons in different ways, after interaction the parameters of the polarization ellipse are changed. Methods registering these changes are called ellipsometry [13].
In SPR conditions, the p-component of the light wave undergoes sufficient changes of magnitude and phase, while the s-component remains practically unchanged. Thus, change of polarization and, respectively, ellipsometer signal generates two processes: polarizing contrast related to the change of magnitude difference of the s- and p-components, and phase contrast, related to their phase shift [54].
The interference pattern on the detector surface itself can provide information on polarization parameters. However, using various phase retarders and polarization modulators it is possible to filter noise and thus increase measurement precision [13]. In some cases the use of ellipsometry in SPR sensors allows resolution of the refractive index to 3.7·10−8 RIU [55, 56].
Heterodyne. Another method of phase shift measurement is using a heterodyne – a device whose operation is based on “beats”. Let us review the nature of the phenomenon.
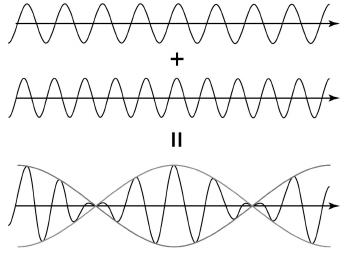
If the frequency of one wave differs slightly from another wave frequency, then wave interference leads to summed wave magnitude along the beam pass being periodically increasing and decreasing. Then, frequency of the envelope-summed wave becomes a few times less than the frequency of the incoming waves (Fig. 6). The value of the envelope wave frequency depends on difference in frequencies of incoming waves. This scheme of wave superposition can be used several times in one device. As a result, it is possible to obtain an envelope wave with frequency a few orders less than the former one and register its phase using a phase meter [57].
This very scheme of phase shift registration was used by Lee and coauthors [58] in the analyzer, which demonstrated a breakthrough resolution by refraction index equal to 2.8·10−9 RIU. When measuring interaction on a chip surface of the model pair mouse IgG/anti-mouse IgG, it corresponded to the limit of detection 10 fg/ml (67 aM).
Fig. 6. Summing waves with similar frequencies (effect of “beats”).
Enhancing Measurement Sensitivity of Intensity Modulation
To be precise, the ellipsometric methods described above for SPR sensors can be treated equally as phase modulation methods and as intensity modulation methods, because signal magnitude change influences polarization ellipse parameters in the same way as phase change does. Among SPR sensors with intensity modulation, these sensors are the most sensitive. However, if the intensity is measured directly, then the intensity modulation registration (magnitude) is characterized by an average resolution of 10−5 RIU and appears to be less sensitive. However, SPR sensor sensitivity with intensity modulation can be increased, for instance, using two sources of radiation with different wavelengths. Sensor signal in this system is determined based on intensity difference of reflected beams with different wavelengths. Sensor resolution by refraction index can be increased up to 2·10−6 RIU [59].
Enhancing Measurement Sensitivity of Resonant Angle
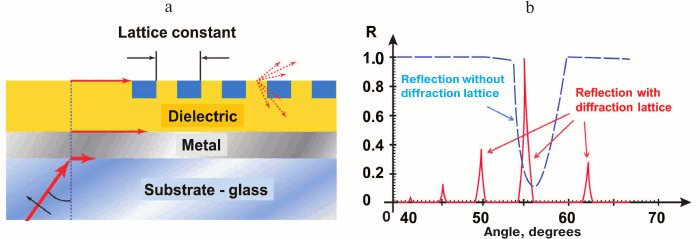
Resonant angle measurement sensitivity is one of the highest in SPR technique, but it still can be increased. Sensitivity of SPR analysis with angle spectra depends first on resonant maximum location registration, which in turn depends on the width of resonant peak and shape of the angle absorption band curve. That is why narrowing of resonant spectrum sufficiently increases analysis sensitivity. Thus, by placing an additional diffraction lattice close to the sensor surface of the SPR analyzer with angle scanning we obtain instead of one wide resonant maximum, a set of narrow peaks corresponding to diffracted beams of various order (Fig. 7). This way, the lines of absorption at the angle radiation pattern are significant – up to thousands of times – narrow in comparison with the original ones. Further sensitivity increase is limited by the spectrum width of radiation source, noises, and thermal drift of the hardware [60].
Fig. 7. SPR sensor with angle modulation and with additional diffraction lattice. a) Basic design of the sensor. b) Comparison of angle spectra of sensors with and without diffraction lattice (schemes prepared with considerations of [60]).
Enhancing Measurement Sensitivity of Resonant Frequency
Sensitivity of SPR sensors operating in wavelength modulation mode can be increased if spectrophotometers with Fourier conversion are used as detectors. These SPR sensors, due to high precision of wavelength measurement, are more sensitive than the standard SPR sensors with measurement of resonant angle and resonant frequency [61]. This approach is used, for instance, in SPR100 sensor of GWC Technologies (USA).
Homola and coauthors [62] developed an SPR sensor with frequency modulation based on the use of polychromic light and architecture with multiple parallel read channels. In this device, the polychromic light beam is collimated and directed at a correlating prism. Having reflected from many sensor channels, the light beams are directed at various measuring inputs of the spectrograph. This implementation of SPR sensor achieved resolution up to 2·10−7 RIU.
For SPR sensors with frequency modulation, silver films provide higher sensitivity in comparison with gold [63]. However, silver is less chemically stable. Thus, bimetallic (silver with gold coating) films retaining chip stability and providing fivefold growth of measurements sensitivity are used quite successfully [64].
Multi-purpose Methods to Increase Sensitivity
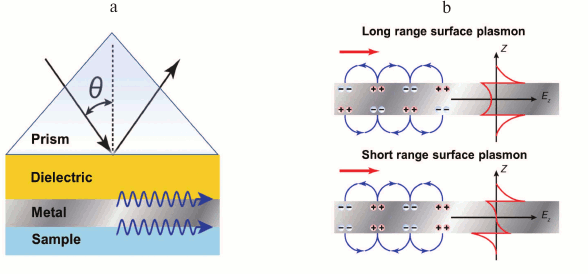
Use of long-range surface plasmons. Already in 1981, Sarid theoretically justified [65] that in thin metal film between two dielectric layers with similar refraction indices, two modes of surface plasmons can emerge, with symmetrical and asymmetrical field profiles (Fig. 8). Emerging from these modes is the consequence of the two surface plasmons interacting on the opposite faces of metal film of thickness comparable with surface depth plasmon field penetration depth. For a symmetrical surface plasmon, the propagation constant and attenuation on metal film thickening increase, and for asymmetrical they decrease. Because the asymmetrical plasmon is attenuating faster than the symmetrical one, the first is called short-range surface plasmon, and the second one long-range surface plasmon.
Fig. 8. Exciting surface plasmons. a) Excitation scheme. b) Charge distribution and field gradient profiles in short range and long range plasmons.
The field of symmetrical surface plasmon penetrates into dielectric media sufficiently deeper than the field of antisymmetrical surface plasmon or the field of common surface plasmon generating on one interface metal–dielectric. Thus, generation of the long-range plasmon leads to sufficient increase of electromagnetic field intensity, which can enhance SPR sensitivity. For instance, Homoda and coauthors [66] suggested a developed configuration of an SPR sensor with excitation of long-range plasmons achieving resolution of 3·10–8 RIU.
Enhancing sensitivity using nano-coatings. Nearly guided wave SPR (NGWSPR). Lahav and coauthors [67] suggested use of an additional dielectric layer in an SPR sensor of 10-15 nm thickness and placed between metal and the analyzed medium. One necessary condition for enhancing sensitivity this way is high refractive index of dielectric. With a thin dielectric layer with high refraction index, excitation of surface plasmons on a metal surface is followed by generation of partially guided waves, which leads to strengthening of electromagnetic field and increasing sensor receptivity. Increasing dielectric layer thickness by one order transforms the layer in coupled plasmon-waveguide resonance (CPWR), but the sensitivity drastically drops due to large distance from plasmon to the sensor surface. That is why high sensitivity measurements require small thickness of the additional dielectric layer. Thus, the use of silver film and 10-nm silicon nano-coating increases analysis sensitivity by four times [67].
Graphene coating for sensor surface. Use of graphene as an additional sensor surface coating also increases sensitivity of SPR sensors. As Wu and coauthors showed [68], signal increase in this case provides charge transfer from graphene to the gold surface. Hence, field intensity on the sensor surface increases, making the sensor more sensitive to changes in nearby surroundings. Zhang and coauthors [69] demonstrated four-fold decrease of the limit of detection of human IgG in an SPR sensor with the use of gold film covered with graphene oxide as the sensor surface.
Enhancing Sensitivity Using Nanoparticles
As far as the signal of an SPR sensor directly depends upon the quantity and weight of the object connected to the surface, and surface wave field penetrates into the medium by several hundred nanometers, the sensitivity of SPR analysis increases by marking interacting molecules with nanoparticles. As markers, nanoparticles of metals can be used (for instance gold or silver), metal oxides (for instance iron oxides), carbon nanotubes, latex particles, and liposomes, as well as combined materials of different nanoparticles [70]. The marking increases measurement sensitivity by hundreds of times. Let us review in details the features of using various kinds of nanoparticles.
Metal nanoparticles. Noble metals nanoparticles are often used as enhancers in SPR sensors. The important advantage of metal nanoparticles is duplex mechanism of SPR enhancement – by increasing weight on the sensor face and by interaction of surface plasmon fields on sensor metal film and the electrons of the nanoparticle (coupling SPR–LSPR). The efficiency of field coupling depends upon the distance between nanoparticle and the surface, size, and shape of the nanoparticle [70-72].
Gold nanoparticles are most commonly used due to high stability, well-developed theoretical methods, as well as the possibility to obtain particles with controlled shape and size. Lyon and coauthors demonstrated [73] 25-fold enhancement of SPR by gold nanoparticles, directly detecting 6.7 pM of human immunoglobulin G.
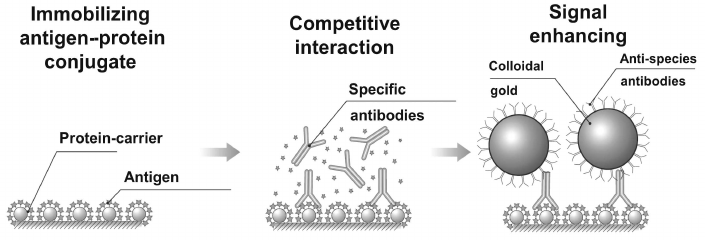
The method is successfully used also in competitive determination of low molecular weight compounds. As enhancers, conjugates of gold particles with specific antibodies can be used; however, as stated by Urusov and coauthors by example of determining ochratoxin A [74], the best results are obtained using indirect enhancement supported by combination of unmodified specific antibodies and conjugate of gold nanoparticles with anti-species antibodies (Fig. 9). Use of conjugate of this type significantly reduced concentration of specific antibodies and hence reduced the limit of detection of ochratoxin A by more than 10-fold – down to 60 pg/ml.
Fig. 9. Scheme for enhancing signal of SPR analysis with gold nanoparticles.
An original enhancement of an SPR sensor was suggested by Cao and coauthors [75] when detecting antibodies against glutamic acid decarboxylase (GAD) – a marker for insulin-dependent diabetes mellitus diagnostics. They used conjugate of gold nanoparticles with covalently ligated anti-species antibodies and horseradish peroxidase. The first stage of enhancement comprised the interaction of the conjugate and the GAD/antibodies complex against GAD. Then they added solution containing 3,3′-diaminobenzidine (DAB) and H2O2. The peroxidase-catalyzed DAB oxidation by peroxide with formation of precipitate provided additional signal enhancement. This approach reduced the limit of detection by four orders of magnitude and allowed detection of antibodies at concentration down to 200 fM.
Magnetic nanoparticles. Functionalized magnetic nanoparticles such as Fe3O4 are also actively used for signal enhancement in SPR sensors. Their main advantage is lower cost compared to noble metal particles and the possibility to conduct operations using magnetic field. These particles can form aggregates on the sensor surface, sufficiently changing refraction index and, respectively, sufficiently enhancing the signal.
Chemical functionalization of magnetic nanoparticles is well developed and can be used to prepare conjugates with various receptor molecules. For instance, Teramura and coauthors [76] developed a scheme for detecting natriuretic peptide (a marker of cardiac failure) with amplification by conjugation of magnetic nanoparticles with streptavidin. The limit of detection was 25 pg/ml, while without enhancement it was 10 ng/ml. Pollet and coauthors [77] described analysis with conjugant enhanced by magnetic particles with specific antibodies, increasing sensitivity when determining peanut allergen Ara h1 100-fold (down to 90 pg/ml). Wang and coauthors [78] in “sandwich” analysis of thrombin used nanoparticles of iron oxide modified by aptamers. The limit of detection of thrombin was 17 pM (versus 27 nM without enhancement).
Carbon nanotubes. Lee and coauthors [79] used conjugates of specific antibodies with carbon nanotubes for SPR detection of human granulocyte macrophage colony-stimulating factor and human erythropoietin. Their studies demonstrated over 30-fold enhancement of SPR signal in comparison with a method using unmarked specific antibodies. The limit of detection for both analytes with enhancement was 100 pg/ml.
Latex nanoparticles were the very first nanomaterials used as enhancers in SPR analysis. They drew attention due to high size and weight, which sufficiently change refraction index of the medium close to the sensor interface. Already in 1993, Severs and Schasfoort suggested SPR enhancement by functionalized latex particles for determining human chorionic gonadotropin, having displayed 30-fold signal enhancement and limit of detection of 5 nM [80].
Liposomes. Spherical hollow formations of one or several phospholipid bilayers are also used as SPR enhancers. Large size of the particles (over 100 nm) leads to the fact that liposome binding significantly changes the refraction index of the medium close to the interface [70]. Wink and coauthors [81] conducted SPR analysis of interferon-γ and demonstrated that use of liposome markers reduced the detection limit down to 100 pg/ml. This is one of the highest criteria of sensitivity enhancement, comparable to double enhancement by gold nanoparticles + precipitation [75].
ENHANCING EFFICIENCY OF SPR SENSORS
Multi-channel systems. One of the main directions in developing SPR sensors is enhancing sensor efficiency. For this purpose, the leading developers of SPR sensors directed efforts at creating multi-channel systems. Already in the late 1990s, Biacore (USA), the leader of SPR sensor industry, presented a system prototype capable of conducting up to eight measurements in parallel channels. One measurements cycle lasts about 4 min, which in combination with an automated sample-pipetting station, allows testing 600 samples per day [82].
We should note the existence of the two related tasks in multiplex analysis: simultaneous analysis of many analytes in one sample, and simultaneous analysis of multiple samples for content of the one analyte. In the first case, the sample can flow in series via sensor elements modified by receptors to various analytes. In the second case, the availability of several parallel channels is necessary. Nevertheless, both tasks can be achieved in a single device. Thus, the Biacore A100 system was created in 2005; it consists of four flow cells, and each cell has five detection spots. This system allows up to 20 measurements per cycle, and the daily efficiency of the system is 3800 measurements. A similar four-channel system is used in the Biacore T100 and Biacore 3000 models [5]. Other manufacturers are also using this approach to enhance efficiency, for instance, the three-channel SensiQ Pioneer (SensiQ Technologies, USA), four-channel Reichert4SPR (Reichert Technologies, USA), five-channel BI4500 Series (Biosensing Instrument, USA), or eight-channel NanoSPR8 481 (NanoSPR Devices, USA).
The reference signal is usually generated in one or in several channels of a multi-channel system, it not being related to a specific interaction. In this way, multi-channel systems enhance not only efficiency, but reliability of the tests as well. Besides, during clinical analysis, the content of any specific biomarker can vary sufficiently, and the parallel testing of several markers of one and the same morbid condition sufficiently increases reliability of the diagnosis [5, 83].
Highly efficient multiplex testing is in demand for resolving a number of tasks – screening of antibodies and aptamers libraries, genotyping, determining organism sensitization to allergens, etc. One of the tasks requiring multiplex testing is detecting pathogens, as infection of an organism with various bacteria or viruses often is of similar symptomatology, and express identification of the disease agent is extremely important for efficient therapy. Thus, Wang and coauthors used a multi-channel SPR sensor based on DNA hybridization for simultaneous determination of four pathogenic bacteria as follows: Pseudomonas aeruginosa, Staphylococcus aureus, Clostridium tetani, and Clostridium perfringens [84]. The achieved limit of DNA detection was 10 pM.
SPR imaging. A breakthrough in multiplex analysis systems was made by SPR imaging (SPRi), making it possible to conduct simultaneous analysis of several hundreds of interactions [85]. These devices were created due to the development of micro-fluid techniques and the technology of manufacturing matrices of sensitive elements with applied receptor molecules of various specificity.
Brockman and Fernández developed an SPR sensor with modulation by intensity based on a polymer lattice covered with gold film. The sensitive element of the sensor is a 2D-matrix of 400 elements, each 250 µm in size. The surface of the sensor is radiated with monochromatic light, while the reflected radiation carrying information on space distribution of SPR intensities is registered by a CCD camera. Sensor resolution by refraction index reaches 10–6 RIU [86]. The minimum detectable concentration of the biological molecules for sensors of this type, as achieved by Baggio and coauthors, is 0.1 nM [87]. This approach was applied to successfully commercialize the FLEXChip system [5, 14].
Many SPRi systems are commercially available and are successfully used in multiplex determination of cancer-specific markers, antibodies, nucleic acids, bacteria, viruses, etc. [3]. The most prospective way seems to be using SPRi for genotyping, as the technology makes possible simultaneous determination of a variety of nucleotide fragments in a short time. Due to smaller size of sensitive element, the SPRi is usually in some degree less sensitive than the standard SPR; however, the use of enhancement (like nanoparticles) makes it possible to detect nucleotide fragments down to femtomolar concentrations. Thus, D’Agata and coauthors [36] used the combination of gold nanoparticles modified by streptavidin and biotinylated oligonucleotides to enhance SPRi. These analyses based on an SPRi-sensor and SPR imager (GWC Technologies) detects single nucleotide polymorphisms with femtomolar measurement sensitivity without preliminary PCR amplification.
CONCLUSION
SPR analysis has found wide application for detecting parameters of complex formation reactions (antigen–antibody, ligand–target, DNA hybridization, etc.). The method is in active use also for resolving various analytic tasks, especially in medicine diagnostics.
In spite of high sensitivity of SPR analysis, it often appears to be insufficient. Today, large numbers of methods are introduced that reduce the limit of detection by some orders of magnitude. Some of these methods require modification of device design (for instance, methods of phase shift measurements, spectroscopy with Fourier conversion, etc.), and others can be used without design changes (for instance, enhancing by nanoparticles).
An important direction in development of SPR systems is enhancing efficiency. Now, multi-channel SPR systems and systems of SPR imaging are available that simultaneously test up to several hundred samples and analytes. These systems also allow fast collection of measurements statistics, this way enhancing analysis reliability.
Emergence of new methods for highly sensitive and efficient analysis, as presented in this review, indicates significant market advantages of SPR detection as analytical mean to resolve fundamental and applied tasks.
The authors thank A. E. Urusov (A. N. Bach Institute of Biochemistry, Research Center of Biotechnology of the Russian Academy of Sciences) for preparing illustrations for this review.
This work was financially supported by the Russian Science Foundation (project No. 14-14-01131).
REFERENCES
1.Schasfoort, R. B. M., and Tudos, A. J. (2008)
Handbook of Surface Plasmon Resonance, The Royal Society of
Chemistry, Cambridge.
2.Ivanov, A. S., and Medvedev, A. E. (2015) Optical
surface plasmon resonance biosensors in molecular fishing, Biomed.
Khim., 61, 231-238.
3.Mariani, S., and Minunni, M. (2014) Surface plasmon
resonance applications in clinical analysis, Anal. Bioanal.
Chem., 406, 2303-2323.
4.Shalabney, A., and Abdulhalim, I. (2011)
Sensitivity-enhancement methods for surface plasmon sensors, Laser
Photon. Rev., 5, 571-606.
5.Situ, C., Buijs, J., Mooney, M. H., and Elliott, C.
T. (2010) Advances in surface plasmon resonance biosensor technology
towards high-throughput, food-safety analysis, Trends Anal.
Chem., 29, 1305-1315.
6.Yuk, J., Hong, D.-G., Jung, J.-W., Jung, S.-H.,
Kim, H.-S., Han, J.-A., Kim, Y.-M., and Ha, K.-S. (2006) Sensitivity
enhancement of spectral surface plasmon resonance biosensors for the
analysis of protein arrays, Eur. Biophys. J., 35,
469-476.
7.Biacore Sensor Surface Handbook (2005) GE
Healthcare Bio-Sciences AB, Uppsala.
8.Oates, T. W. H., Wormeester, H., and Arwin, H.
(2011) Characterization of plasmonic effects in thin films and
metamaterials using spectroscopic ellipsometry, Prog. Surf.
Sci., 86, 328-376.
9.Lakowicz, J. R. (2006) Plasmonics in biology and
plasmon-controlled fluorescence, Plasmonics, 1, 5-33.
10.Li, M., Cushing, S. K., and Wu, N. (2015)
Plasmon-enhanced optical sensors: a review, Analyst, 140,
386-406.
11.De Mol, N. J., and Fischer, M. J. E. (2010)
Surface Plasmon Resonance. Methods and Protocols, Springer
Science, New York.
12.Brongersma, M. L., and Kik, P. G. (2007)
Surface Plasmon Nanophotonics, Springer Series in Optical
Sciences, Vol. 131, Springer Science, Berlin.
13.Huang, Y. H., Ho, H. P., Wu, S. Y., and Kong, S.
K. (2012) Detecting phase shifts in surface plasmon resonance: a
review, Adv. Opt. Technol., doi: 10.1155/2012/471957.
14.Homola, J. (2008) Surface plasmon resonance
sensors for detection of chemical and biological species, Chem.
Rev., 108, 462-493.
15.Tokel, O., Inci, F., and Demirci, U. (2014)
Advances in plasmonic technologies for point of care applications,
Chem. Rev., 114, 5728-5752.
16.Otto, A. (1968) Excitation of nonradiative
surface plasma waves in silver by the method of frustrated total
reflection, Z. Physik, 216, 398-410.
17.Kretschmann, E., and Raether, H. (1968) Radiative
decay of non-radiative surface plasmons excited by light, Z.
Naturforsch., 23A, 2135-2136.
18.Nagata, K., and Handa, H. (2000) Real-Time
Analysis of Biomolecular Interactions: Applications of BIACORE,
Springer Science, Tokyo.
19.Jorgenson, R. C., and Yee, S. S. (1993) A
fiber-optic chemical sensor based on surface plasmon resonance,
Sens. Actuators B Chem., 12, 213-220.
20.Homola, J., Yee, S. S., and Gauglitz, G. (1999)
Surface plasmon resonance sensors: review, Sens. Actuators B
Chem., 54, 3-15.
21.Cullen, D. C., Brown, R. G., and Lowe, C. R.
(1987) Detection of immunocomplex formation via surface plasmon
resonance on gold coated diffraction gratings, Biosensors,
3, 211-225.
22.Cullen, D. C., and Lowe, C. R. (1990) A direct
surface plasmon-polariton immunosensor: preliminary investigation of
the non-specific adsorption of serum components to the sensor
interface, Sens. Actuators B Chem., 1, 576-579.
23.Jory, M. J., Vukusic, P. S., and Sambles, J. R.
(1994) Development of a prototype gas sensor using surface plasmon
resonance on gratings, Sens. Actuators B Chem., 17,
203-209.
24.Mayer, K. M., and Hafner, J. H. (2011) Localized
surface plasmon resonance sensors, Chem. Rev., 111,
3828-3857.
25.Homola, J. (2006) Surface plasmon resonance based
sensors, in Springer Series on Chemical Sensors and
Biosensors, Ser. 4, Springer Science, Berlin.
26.McNaught, A. D., and Wilkinson, A. (1997)
IUPAC Compendium of Chemical Terminology. The Gold Book (2nd
Edn.) Blackwell Science Publications, Oxford.
27.Inczedy, J., Lengyel, T., and Ure, A. M. (1998)
IUPAC. Compendium of Analytical Nomenclature. The Orange Book
(3rd Edn.) Blackwell Science Publications, Oxford.
28.Huang, Y. H., Ho, H. P., Wu, S. Y., Kong, S. K.,
Wong, W. W., and Shum, P. (2011) Phase sensitive SPR sensor for wide
dynamic range detection, Opt. Lett., 36, 4092-4094.
29.Huang, Y. H., Ho, H. P., Kong, S. K., and
Kabashin, A. V. (2012) Phase-sensitive surface plasmon resonance
biosensors: methodology, instrumentation and applications, Ann.
Phys., 524, 637-662.
30.Hermanson, G. T. (2008) Bioconjugate
Techniques (2nd Edn.) Academic Press, San Diego.
31.D’Agata, R., and Spoto, G. (2012)
Artificial DNA and surface plasmon resonance, Artif. DNA PNA
XNA, 3, 45-52.
32.Luzi, E., Minunni, M., Tombelli, S., and Mascini,
M. (2003) New trends in affinity sensing: aptamers for ligand binding,
Trends Anal. Chem., 22, 810-818.
33.Hendrickson, O. D., Zherdev, A. V., and Dzantiev,
B. B. (2006) Molecularly imprinted polymers and their use in biological
analysis, Usp. Biol. Khim., 46, 149-192.
34.Knoll, W., Liley, M., Piscevic, D., Spinke, J.,
and Tarlov, M. J. (1997) Supramolecular architectures for the
functionalization of solid surfaces, Adv. Biophys., 34,
231-251.
35.Brockman, J. M., Frutos, A. G., and Corn, R. M.
(1999) A multistep chemical modification procedure to create DNA arrays
on gold surfaces for the study of protein–DNA interactions with
surface plasmon resonance imaging, J. Am. Chem. Soc.,
121, 8044-8051.
36.D’Agata, R., Corradini, R., Grasso, G.,
Marchelli, R., and Spoto, G. (2008) Ultrasensitive detection of DNA by
PNA and nanoparticle‐enhanced surface plasmon resonance imaging,
Chembiochem, 9, 2067-2070.
37.Fang, S., Lee, H. J., Wark, A. W., and Corn, R.
M. (2006) Attomole microarray detection of microRNAs by
nanoparticle-amplified SPR imaging measurements of surface
polyadenylation reactions, J. Am. Chem. Soc., 128,
14044-14046.
38.Egawa, Y., Miki, R., and Seki, T. (2014)
Colorimetric sugar sensing using boronic acid-substituted azobenzenes,
Materials, 7, 1201-1220.
39.Makaraviciute, A., and Ramanaviciene, A. (2013)
Site-directed antibody immobilization techniques for immunosensors,
Biosens. Bioelectron., 50, 460-471.
40.Chivers, C. E., Crozat, E., Chu, C., Moy, V. T.,
Sherratt, D. J., and Howarth, M. (2010) A streptavidin variant with
slower biotin dissociation and increased mechanostability, Nat.
Methods, 7, 391-393.
41.Sipova, H., and Homola, J. (2013) Surface plasmon
resonance sensing of nucleic acids: a review, Anal. Chim. Acta,
773, 9-23.
42.Luppa, P. B., Sokoll, L. J., and Chan, D. W.
(2001) Immunosensors – principles and applications to clinical
chemistry, Clin. Chim. Acta, 314, 1-26.
43.Mullett, W. M., Lai, E. P., and Yeung, J. M.
(2000) Surface plasmon resonance-based immunoassays, Methods,
22, 77-91.
44.D’Agata, R., and Spoto, G. (2013) Surface
plasmon resonance imaging for nucleic acid detection, Anal. Bioanal.
Chem., 405, 573-584.
45.Zhen, G., Falconnet, D., Kuennemann, E., Voros,
J., Spencer, N. D., Textor, M., and Zurcher, S. (2006) Nitrilotriacetic
acid functionalized graft copolymers: a polymeric interface for
selective and reversible binding of histidine‐tagged proteins,
Adv. Funct. Mater., 16, 243-251.
46.Kabashin, A. V., and Nikitin, P. I. (1997)
Interferometer based on a surface plasmon resonance for sensor
applications, Quantum Elec., 27, 653-654.
47.Kabashin, A. V., and Nikitin, P. I. (1998)
Surface plasmon resonance interferometer for bio- and chemical-sensors,
Opt. Commun., 150, 5-8.
48.Yuan, W., Ho, H. P., Wong, C. L., Kong, S. K.,
and Lin, C. (2007) Surface plasmon resonance biosensor incorporated in
a Michelson interferometer with enhanced sensitivity, IEEE Sens.
J., 7, 70-73.
49.Ho, H. P., Yuan, W., Wong, C. L., Wu, S. Y.,
Suen, Y. K., Kong, S. K., and Lin, C. (2007) Sensitivity enhancement
based on application of multi-pass interferometry in phase-sensitive
surface plasmon resonance biosensor, Opt. Commun., 275,
491-496.
50.Kochergin, V. E., Valeiko, M. V., Beloglazov, A.
A., Ksenevich, T. I., and Nikitin, P. I. (1998) Visualization of the
angular dependence of the reflected-radiation phase under conditions of
a surface plasmon resonance and its sensor applications, Quantum
Elec., 28, 835-839.
51.Nikitin, P. I., Beloglazov, A. A., Kochergin, V.
E., Valeiko, M. V., and Ksenevich, T. I. (1999) Surface plasmon
resonance interferometry for biological and chemical sensing, Sens.
Actuators B Chem., 54, 43-50.
52.Chen, S. J., Su, Y. D., Hsiu, F. M., Tsou, C. Y.,
and Chen, Y. K. (2005) Surface plasmon resonance phase-shift
interferometry: real-time DNA microarray hybridization analysis, J.
Biomed. Opt., 10, doi: 10.1117/1.1924713.
53.Wu, S. Y., Ho, H. P., Law, W. C., Lin, C., and
Kong, S. K. (2004) Highly sensitive differential phase-sensitive
surface plasmon resonance biosensor based on the Mach–Zehnder
configuration, Opt. Lett., 29, 2378-2380.
54.Kabashin, A. V., Kochergin, V. E., and Nikitin,
P. I. (1999) Surface plasmon resonance bio- and chemical sensors with
phase-polarization contrast, Sens. Actuators B Chem., 54,
51-56.
55.Chiang, H. P., Lin, J. L., and Chen, Z. W. (2006)
High sensitivity surface plasmon resonance sensor based on phase
interrogation at optimal incident wavelengths, Appl. Phys.
Lett., 88, doi: 10.1063/1.2192622.
56.Chiang, H. P., Lin, J. L., Chang, R., Su, S. Y.,
and Leung, P. T. (2005) High-resolution angular measurement using
surface plasmon resonance via phase interrogation at optimal incident
wavelengths, Opt. Lett., 30, 2727-2729.
57.Nelson, S. G., Johnston, K. S., and Yee, S. S.
(1996) High sensitivity surface plasmon resonance sensor based on phase
detection, Sens. Actuators B Chem., 35, 187-191.
58.Li, Y. C., Chang, Y. F., Su, L. C., and Chou, C.
(2008) Differential-phase surface plasmon resonance biosensor, Anal.
Chem., 80, 5590-5595.
59.Zybin, A., Grunwald, C., Mirsky, V. M., Kuhlmann,
J., Wolfbeis, O. S., and Niemax, K. (2005) Double-wavelength technique
for surface plasmon resonance measurements: basic concept and
applications for single sensors and two-dimensional sensor arrays,
Anal. Chem., 77, 2393-2399.
60.Palagushkin, A. N., Prokopenko, S. A., and
Sergeev, A. P. (2009) Plasmonic holographic nanostructures, Opt.
Mem. Neural Networks, 18, 156-163.
61.Frutos, A. G., Weibel, S. C., and Corn, R. M.
(1999) Near-infrared surface plasmon resonance measurements of
ultrathin films. 2. Fourier transform SPR spectroscopy, Anal.
Chem., 71, 3935-3940.
62.Homola, J., Dostalek, J., Chen, S., Rasooly, A.,
Jiang, S., and Yee, S. S. (2002) Spectral surface plasmon resonance
biosensor for detection of staphylococcal enterotoxin B in milk,
Int. J. Food Microbiol., 75, 61-69.
63.Homola, J., Koudela, I., and Yee, S. S. (1999)
Surface plasmon resonance sensors based on diffraction gratings and
prism couplers: sensitivity comparison, Sens. Actuators B Chem.,
54, 16-24.
64.Lecaruyer, P., Canva, M., and Rolland, J. (2007)
Metallic film optimization in a surface plasmon resonance biosensor by
the extended Rouard method, Appl. Opt., 46,
2361-2369.
65.Sarid, D. (1981) Long-range surface-plasma wave
on very thin metal films, Phys. Rev. Lett., 47,
1927-1930.
66.Slavik, R., and Homola, J. (2007) Ultrahigh
resolution long range surface plasmon-based sensor, Sens. Actuators
B Chem., 123, 10-12.
67.Lahav, A., Auslender, M., and Abdulhalim, I.
(2008) Sensitivity enhancement of guided-wave surface-plasmon resonance
sensors, Opt. Lett., 33, 2539-2541.
68.Wu, L., Chu, H. S., Koh, W. S., and Li, E. P.
(2010) Highly sensitive graphene biosensors based on surface plasmon
resonance, Opt. Express, 18, 14395-14400.
69.Zhang, H., Sun, Y., Gao, S., Zhang, J., Zhang,
H., and Song, D. (2013) A novel graphene oxide‐based surface
plasmon resonance biosensor for immunoassay, Small, 9,
2537-2540.
70.Zeng, S., Baillargeat, D., Ho, H. P., and Yong,
K. T. (2014) Nanomaterials enhanced surface plasmon resonance for
biological and chemical sensing applications, Chem. Soc. Rev.,
43, 3426-3452.
71.Springer, T., Ermini, M. L., Spackova, B.,
Jablonku, J., and Homola, J. (2014) Enhancing sensitivity of surface
plasmon resonance biosensors by functionalized gold nanoparticles: size
matters, Anal. Chem., 86, 10350-10356.
72.Kwon, M. J., Lee, J., Wark, A. W., and Lee, H. J.
(2012) Nanoparticle-enhanced surface plasmon resonance detection of
proteins at attomolar concentrations: comparing different nanoparticle
shapes and sizes, Anal. Chem., 84, 1702-1707.
73.Lyon, L. A., Musick, M. D., and Natan, M. J.
(1998) Colloidal Au-enhanced surface plasmon resonance immunosensing,
Anal. Chem., 70, 5177-5183.
74.Urusov, A. E., Kostenko, S. N., Sveshnikov, P.
G., Zherdev, A. V., and Dzantiev, B. B. (2011) Ochratoxin A immunoassay
with surface plasmon resonance registration: lowering limit of
detection by the use of colloidal gold immunoconjugates, Sens.
Actuators B Chem., 156, 343-349.
75.Cao, C., and Sim, S. J. (2007) Signal enhancement
of surface plasmon resonance immunoassay using enzyme
precipitation-functionalized gold nanoparticles: a femtomolar level
measurement of anti-glutamic acid decarboxylase antibody, Biosens.
Bioelectron., 22, 1874-1880.
76.Teramura, Y., Arima, Y., and Iwata, H. (2006)
Surface plasmon resonance-based highly sensitive immunosensing for
brain natriuretic peptide using nanobeads for signal amplification,
Anal. Biochem., 357, 208-215.
77.Pollet, J., Delport, F., Janssen, K. P. F., Tran,
D. T., Wouters, J., Verbiest, T., and Lammertyn, J. (2011) Fast and
accurate peanut allergen detection with nanobead enhanced optical fiber
SPR biosensor, Talanta, 83, 1436-1441.
78.Wang, J., Munir, A., Zhu, Z., and Zhou, H. S.
(2010) Magnetic nanoparticle enhanced surface plasmon resonance sensing
and its application for the ultrasensitive detection of magnetic
nanoparticle-enriched small molecules, Anal. Chem., 82,
6782-6789.
79.Lee, E. G., Park, K. M., Jeong, J. Y., Lee, S.
H., Baek, J. E., Lee, H. W., and Chung, B. H. (2011) Carbon
nanotube-assisted enhancement of surface plasmon resonance signal,
Anal. Biochem., 408, 206-211.
80.Severs, A. H., and Schasfoort, R. B. M. (1993)
Enhanced surface plasmon resonance inhibition test (ESPRIT) using latex
particles, Biosens. Bioelectron., 8, 365-370.
81.Wink, T., van Zuilen, S. J., Bult, A., and Van
Bennekom, W. P. (1998) Liposome-mediated enhancement of the sensitivity
in immunoassays of proteins and peptides in surface plasmon resonance
spectrometry, Anal. Chem., 70, 827-832.
82.Situ, C., Crooks, S. R., Baxter, A. G., Ferguson,
J., and Elliott, C. T. (2002) On-line detection of sulfamethazine and
sulfadiazine in porcine bile using a multi-channel high-throughput SPR
biosensor, Anal. Chim. Acta, 473, 143-149.
83.Cacciatore, G., Eisenberg, S. W., Situ, C.,
Mooney, M. H., Delahaut, P., Klarenbeek, S., and Elliott, C. T. (2009)
Effect of growth-promoting 17β-estradiol, 19-nortestosterone and
dexamethasone on circulating levels of nine potential biomarker
candidates in veal calves, Anal. Chim. Acta, 637,
351-359.
84.Wang, J., Luo, Y., Zhang, B., Chen, M., Huang,
J., Zhang, K., and Liao, P. (2011) Rapid label-free identification of
mixed bacterial infections by surface plasmon resonance, J. Transl.
Med., 9, 85.
85.Homola, J., Vaisocherova, H., Dostalek, J., and
Piliarik, M. (2005) Multi-analyte surface plasmon resonance biosensing,
Methods, 37, 26-36.
86.Brockman, J. M., and Fernandez, S. M. (2001)
Grating-coupled surface plasmon resonance for rapid, label-free,
array-based sensing, Am. Lab., 33, 37-40.
87.Baggio, R., Carven, G. J., Chiulli, A., Palmer,
M., Stern, L. J., and Arenas, J. E. (2005) Induced fit of an epitope
peptide to a monoclonal antibody probed with a novel parallel surface
plasmon resonance assay, J. Biol. Chem., 280,
4188-4194.
