High-Throughput Glycomics: Optimization of Sample Preparation
I. Trbojević Akmačić1, I. Ugrina1, J. Štambuk1, I. Gudelj1, F. Vučković1, G. Lauc1,2, and M. Pučić-Baković1*
1Genos Glycoscience Research Laboratory, Hondlova 2/11, 10000 Zagreb, Croatia; fax: +385-1-2352-667; E-mail: mpucicbakovic@genos.hr2University of Zagreb, Faculty of Pharmacy and Biochemistry, A. Kovačića 1, 10000 Zagreb, Croatia
* To whom correspondence should be addressed.
Received February 2, 2015; Revision received February 24, 2015
Glycosylation affects structure, folding, and function of numerous proteins. Aberrant glycosylation has been shown to be associated with different diseases. A wide range of analytical methods is available for glycan analysis of antibodies (mainly IgG), but analysis of plasma glycans is less established due to additional challenges encountered with higher complexity of the sample. Here we describe development and optimization of a high-throughput sample preparation method for hydrophilic interaction liquid chromatography and ultra-performance liquid chromatography analysis of plasma N-glycans. Clean-up of labeled glycans was found to be the largest source of variation, and we tested cellulose, silica gel, Bio-Gel, and hydrophilic GHP filter as stationary phases for solid-phase extraction. All stationary phases were shown to be suitable for purification of labeled glycans, but GHP filter plate in combination with cold 96% acetonitrile had the highest reproducibility and was easiest to work with. The method was further optimized with Plackett–Burman screening design and validated in terms of analysis of major step variation and between-day and between-person variation. The developed method is fast, cost-effective, and easy to perform, and it has very good reproducibility during long period of time, enabling the detection of biological variability of the plasma N-glycome.
KEY WORDS: plasma, glycans, high-throughput, glycome analysis, HILIC, UPLCDOI: 10.1134/S0006297915070123
Abbreviations: 2-AB, 2-aminobenzamide; ACN, acetonitrile; CV, coefficient of variation; GHP, hydrophilic polypropylene; HILIC, hydrophilic interaction liquid chromatography; 2-PB, 2-picoline borane; SPE, solid-phase extraction; UPLC, ultra-performance liquid chromatography.
Glycosylation, the attachment of sugar moieties or glycans to proteins,
is a cotranslational and posttranslational modification of proteins
that affects glycoprotein structure and proper folding and, as a
consequence, their functions. Glycosylation is essential for the
interaction of proteins on the surface of the cell, cell signalization,
and recognition; it is the result of both genetic and environmental
factors. Changes in glycosylation are associated with different
diseases, such as autoimmune diseases, infectious diseases, congenital
disorders of glycosylation, and cancer [1, 2]. Therefore, there is need for sensitive and robust
high-throughput methodology for the analysis of glycans. Currently,
there are several high-throughput approaches for N-glycan
analysis: ultra-performance liquid chromatography (UPLC), liquid
chromatography mass spectrometry (LC-MS), capillary gel electrophoresis
(CGE), and matrix-assisted laser desorption/ionization mass
spectrometry (MALDI-MS) that have recently been compared for the
analysis of IgG glycosylation [3]. UPLC is being
widely used because of relatively low cost of equipment, very good,
reliable, and robust quantification, and the ability to separate glycan
isomers. The standard procedure for UPLC analysis includes
deglycosylation of proteins, labeling of released glycans with
fluorescent dye (usually 2-aminobenzamide, 2-AB), a clean-up procedure
to wash out excess of reagents, and finally fluorescent detection of
labeled and purified glycans. To date, different sample preparation
workflows have been reported [4-6]. Once a “gold standard”,
deglycosylation of immobilized proteins in SDS-PAGE gels reported by
Royle et al. [4] was very labor-intensive,
taking three days of bench work, and the efficiency of glycan recovery
from the gel could affect the reproducibility of the method. Burnina et
al. [5] and Stockmann et al. [6] developed sample preparation workflows for UPLC
analysis of IgG N-glycans using hydrophobic and 10-kDa 96-well
plates, respectively. However, in our experience, these plates were not
reproducible in the longer run, have limited capacity, or demand
additional clean-up steps, which makes the workflow time-consuming and
no longer very cost-effective. Method development for N-glycan
analysis was mostly focused on analyzing commercial antibodies or
antibodies isolated from human blood, specifically IgG; analysis of
total plasma or serum N-glycans is somewhat more challenging
because of the presence of many different glycoproteins that originate
from different cell types, where they undergo cell type-specific
glycosylation and whose concentration can vary in many physiological
processes [7-9]. In addition,
the plasma or serum N-glycome contains more complex sialylated
glycan structures that are prone to desialylation. When dealing with so
many layers of complexity, it is essential to develop a method with
acceptable experimental noise and that should be high-throughput, easy
to perform, relatively inexpensive, reproducible, and robust. Here we
describe development, optimization, and validation of such a sample
preparation method for UPLC analysis of plasma N-glycans.
MATERIALS AND METHODS
Plasma samples. Pooled plasma sample from three apparently healthy male adult volunteers was used for method development, all optimizations, and as a standard in between-day and between-person variation experiments. For between-day and between-person variation experiments, plasma sample was taken from five healthy male and five healthy female adult volunteers between 30 and 45 years of age (median = 33.0, SD = 6.8) and between 29 and 46 years of age (median = 31.0, SD = 7.5), respectively, on three separate days (first, second, and tenth day), aliquoted and frozen at –20°C until the day of experiment.
Glycan release and labeling. The whole procedure was done in a 96-well plate manner, and ultrapure water was used throughout. Plasma sample (10 µl) was denatured with the addition of 20 µl 2% (w/v) SDS (Invitrogen, USA) and by incubation at 65°C for 10 min. After cooling to room temperature for 30 min, 10 µl of 4% (v/v) Igepal-CA630 (Sigma-Aldrich, USA) was added, and the mixture was shaken for 15 min on a plate shaker (GFL, Germany). N-Glycans were released with the addition of 1.2 U of PNGase F (Promega, USA) in 10 µl 5× PBS and overnight incubation at 37°C. The released N-glycans were labeled with 2-AB. The labeling mixture was freshly prepared by dissolving 2-AB (19.2 mg/ml; Sigma-Aldrich) and 2-picoline borane (2-PB, 44.8 mg/ml; Sigma-Aldrich) in dimethylsulfoxide (Sigma-Aldrich) and glacial acetic acid (Merck, Germany) mixture (70 : 30 v/v). To each N-glycan sample in the 96-well plate, 25 µl of labeling mixture was added, and the plate was sealed using adhesive seal. Mixing was achieved by shaking for 10 min, followed by 2 h incubation at 65°C.
Clean-up procedures. Free label and reducing agent were removed from the samples using hydrophilic interaction liquid chromatography solid-phase extraction (HILIC-SPE). After cooling to room temperature for 30 min, samples (in a volume of 75 µl) were brought to a certain percentage of acetonitrile (ACN, v/v) by adding 300 µl of ACN (Fluka, USA) (for 80%), 675 µl of ACN (for 90%), or 700 µl of ACN (for >90%). Two hundred microliters of 0.1 g/ml suspension of microcrystalline cellulose (Merck) in water and silica gel (grade 15, 30-60 mesh; Sigma-Aldrich) or Bio-Gel P-6 (50-100 mesh; Bio-Rad, USA) in water–ethanol–acetonitrile (70 : 20 : 10 v/v, incubated for 4 h at room temperature before use) was applied to each well of a 0.2 µm GHP filter plate (Pall Corporation, USA). Solvent was removed by application of vacuum using a vacuum manifold (Millipore Corporation, USA). All wells were prewashed using 5 × 200 µl ultrapure water, followed by equilibration using 3 × 200 µl cold (at 4°C) ACN of the same percentage used for subsequent washing procedure (80, 90, or 100% v/v). In case when only 0.2 µm GHP filter was used as stationary phase, wells were prewashed with 200 µl 70% ethanol (v/v), 200 µl ultrapure water and 200 µl cold ACN of percentage used for washing procedure (80, 90, 92, 96, or 100% v/v). The samples were loaded into the wells, and after a short incubation subsequently washed with 7 × 200 µl ACN of the specified percentage. For each combination of stationary phase and percentage of ACN, all washes were collected for first and last sample in each column of a 96-well plate to check for the extent of glycan loses. Glycans were eluted with 2 × 100 µl of ultrapure water after 15 min shaking at room temperature, and combined eluates were stored at –20°C until use. In the case when Bio-Gel was used as a stationary phase, additional 75 µl of ultrapure water was added to each well, shaken for 15 min at room temperature, eluted, and combined with the first two eluates.
Robustness of the method. Robustness of the developed method with clean-up on GHP plate and with 96% ACN (v/v) was tested by Plackett–Burman screening design as previously described by Novokmet et al. [10]. This is a two level design in which every factor is observed at high and low level. In total seven factors were selected across 16 reactions, as shown in Table 1. Each experiment was performed in eight replicates with the same plasma sample. All other steps that are not noted in Table 1 were performed as described in previous sections. The effect that each factor has on average peak area or coefficient of variation (CV) was estimated using 7-way analysis of variation (ANOVA) approach; p-values less than 0.05 were considered significant.
Table 1. Plackett–Burman screening
design for testing the robustness of the method in 16 reactions
(R01-R16)
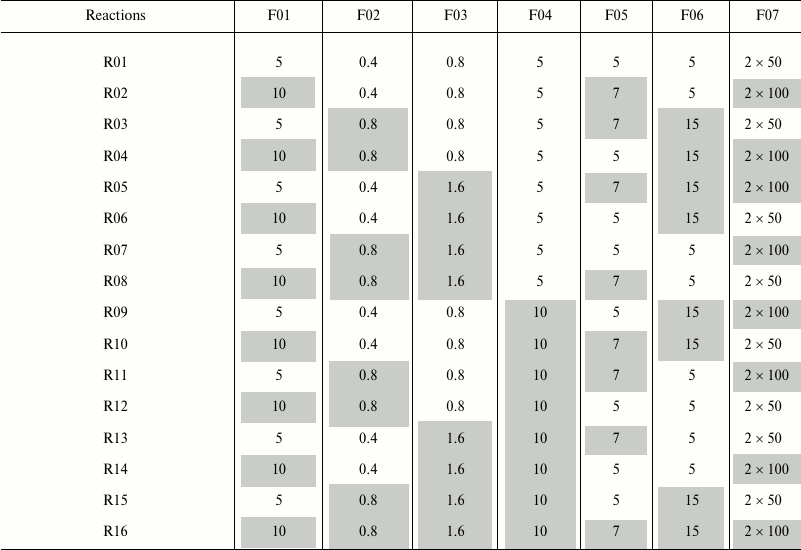
Notes: Investigated factors are as follows: F01 – volume of
initial plasma sample, µl; F02 – SDS concentration in
deglycosylation reaction (in volume of 50 µl), % (w/v); F03
– Igepal concentration in deglycosylation reaction (in volume of
50 µl), % (v/v); F04 – incubation time of sample on a
GHP filter, min; F05 – number of washing steps during
clean-up procedure; F06 –incubation time with H2O
before each elution step, min; F07 – volume of
H2O for glycan elution from GHP filter, µl. Low
level of each factor is shown uncolored, and high value is shown
colored in gray. In case when 5 µl of initial sample was
taken for the analysis, 5 µl of ultrapure H2O was
added to correct for the initial volume difference.
Analysis of source of variation. To determine which major step in sample preparation is introducing most of the variation and potentially needs further optimization, samples were pooled in different time points to remove the variation of previous steps: A, after deglycosylation; B, after labeling; C, after clean-up; D, samples were not pooled at any step (n = 24 replicates for each time point). Before the UPLC run, samples were randomized so that eight samples per each condition are run in the same sample set to eliminate possible false differences that could be attributed to the chromatography. Also, one whole plate (96 samples) was pooled after the whole sample preparation and aliquoted into a new plate to test the variation of chromatography during three separate sample set runs. All samples were prepared using conditions determined as optimal after testing the robustness of the method.
Between-day and between-person variation. Variation of optimized method between days and between persons was determined by analyzing one 96-well plate of same samples by three different analysts on two different days (three weeks apart). Prior to these experiments, samples were pipetted in all six plates in the same order on the same day by the same person to exclude the variation of pipetting before method testing. Samples were then frozen at –20°C until the day of the experiment.
Ultra-performance liquid chromatography. Fluorescently labeled N-glycans were separated by HILIC on an Acquity UPLC instrument (Waters, USA) consisting of a quaternary solvent manager, sample manager, and an FLR fluorescence detector set with excitation and emission wavelengths of 250 and 428 nm, respectively. The instrument was under the control of Empower 3 software, build 3471 (Waters). Labeled N-glycans were separated on a Waters BEH Glycan chromatography column, 150 × 2.1 mm i.d., 1.7 µm BEH particles, with 100 mM ammonium formate, pH 4.4, as solvent A and ACN as solvent B. The separation method used a linear gradient of 30-47% solvent A at flow rate of 0.56 ml/min in a 23 min analytical run. Samples were maintained at 10°C before injection, and the separation temperature was 25°C. The system was calibrated using an external standard of hydrolyzed and 2-AB labeled glucose oligomers, from which the retention times for the individual glycans were converted to glucose units. Data processing was performed using an automatic processing method with a traditional integration algorithm, after which each chromatogram was manually corrected to maintain the same intervals of integration for all the samples. The chromatograms were all separated in the same manner into 39 peaks, and the amount of glycans in each peak was expressed as % of total integrated area. The peaks were assigned according to Saldova et al. [9].
Data analysis. Data analysis was conducted with R (version 3.1.1), a free software environment for statistical computing and graphics.
RESULTS AND DISCUSSION
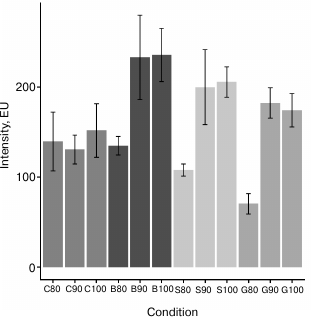
Development of clean-up procedure. To develop a reproducible and high-throughput sample preparation method for UPLC analysis of plasma-derived N-glycans (Fig. 1) that will also be cost-effective and robust, we decided to perform deglycosylation of plasma samples with PNGase F in solution, adding denaturation detergent and buffer with enzyme directly to the sample. In this way we eliminated the cost of extra reagents (which was the case in the method reported by Royle et al. [4]) and the cost of additional membrane plates [5, 6]. Although the PNGase F reaction can be carried out in less than 1 h (but with more enzyme units) [5, 6, 11], we chose the incubation at 37°C overnight due to convenience and lower cost of the enzyme used. After the deglycosylation and labeling reaction, it is necessary to efficiently remove the proteins and excess of reagents from labeled glycans before the UPLC analysis. We tested four different stationary phases for a solid-phase extraction clean-up procedure: microcrystalline cellulose, silica gel, Bio-Gel P-6, and hydrophilic 0.2 µm GHP filter in combination with three different percentages of ACN (80, 90, and 100%), in eight replicates for each condition. All four matrices showed significant and variable glycan loses during washing steps when 80% ACN was used, especially silica gel and GHP filter (profiles not shown). Also, in the case of GHP filter, glycan profile was significantly different from all other combinations, which was a result of extensive loss of neutral glycans (profiles not shown). As expected, CVs of relative percentage areas (eight replicates) were very high when 80% ACN was being used for washing the excess of reagents (cellulose had 30/39 peaks with CV > 10%, silica gel 10/39 peaks with CV > 10%, and GHP 16/39 peaks with CV > 10%). Surprisingly, Bio-Gel in combination with 80% ACN gave very good results (just eight out of 39 peaks had CV > 5%). Washing with 90 and 100% ACN resulted in highest intensities (Fig. 2), and also the highest reproducibility for Bio-Gel, silica gel, and GHP filter. Average CVs of all 39 peaks in case of Bio-Gel were 4.5 and 4.9%, silica gel 2.6 and 2.8%, and GHP 4.9 and 4.5% for 90 and 100% ACN, respectively. This was not the case for clean-up with cellulose, since some of the profiles had very low amounts of sialylated glycans, which is most likely a result of selective loss of glycans during the clean-up procedure, and this is the reason why cellulose was excluded from further experiments. On the other hand, despite the high reproducibility, Bio-Gel and silica gel were quite difficult to work with, mainly because of the clogging of pipetting tips, which introduced variation in the amount of stationary phase used and led to glycan loses. Since GHP filter plate in combination with 90 and 100% ACN gave very good results, was extremely easy to work with, and required no additional stationary phase, we used these conditions as the starting point for further optimization.
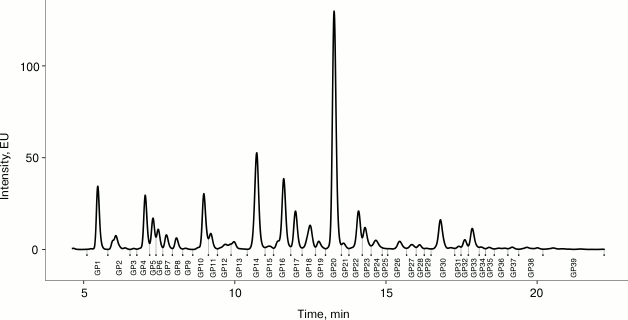
Fig. 1. Representative chromatogram of plasma N-glycome. Fluorescently labeled plasma N-glycans were separated by HILIC-UPLC into 39 peaks (GP1-GP39).
Fig. 2. Intensities of highest peak in chromatograms of plasma N-glycan samples. Different stationary phases were used for clean-up procedure: microcrystalline cellulose (C), silica gel (S), Bio-Gel P-6 (B), and hydrophilic GHP filter (G) in combination with different percentages of ACN (80, 90, and 100%). Error bars represent standard deviation (n = 8).
In the next step, we tested GHP filter in combination with 92, 96, and 100% ACN, in eight replicates for each condition, and got very similar intensities of the highest peak: 186 ± 12, 184 ± 5, and 183 ± 12 EU, respectively. However, when 96% ACN was used for clean-up procedure, only 4/39 peaks had CVs > 5%, while in the case of 92% ACN, 10/39 peaks had CVs > 5%, and in the case of 100% ACN, 14/39 peaks had CVs > 5%. This is probably due to a fact that glycans do not bind very strongly to GHP filter and are easily washed out when there is more than few percent of water in washing solution. On the other hand, if 100% ACN is used as washing solvent, salts, the excess of label, and proteins are not washed away efficiently. Thus, 0.2 µm GHP filter plate was used as stationary phase in combination with cold 96% ACN for clean-up of labeled N-glycans in robustness and method validation experiments.
Robustness of sample preparation method. Robustness of the developed method for UPLC analysis of plasma N-glycans was tested by Plackett–Burman screening design. We selected seven factors and performed in total 16 reactions (eight replicates in each, Table 1) to determine the effect that each factor has on average peak area or coefficient of variation (Table 2).
Table 2. Positive (causing increase in peak
area, uncolored) and negative (causing decrease in peak area, colored
in gray) effects of factors in Plackett–Burman screening design
with p-values for the most abundant N-glycan peaks of
different complexity

Notes: Investigated factors are as follows: F01 – volume of
initial plasma sample, µl; F02 – SDS concentration in
deglycosylation reaction (in volume of 50 µl), % (w/v); F03
– Igepal concentration in deglycosylation reaction (in volume of
50 µl), % (w/v); F04 – incubation time of sample on a
GHP filter, min; F05 – number of washing steps during
clean-up procedure; F06 – incubation time with H2O
before each elution step, min; F07 – volume of
H2O for glycan elution from GHP filter, µl.
Positive effects are shown uncolored, negative effects are shown in
gray color, significant values (p < 0.05) are bolded.
Abbreviations: all N-glycans have core sugar sequence consisting
of two N-acetylglucosamines (GlcNAc) and three mannose residues;
F indicates a core fucose α1-6 linked to the inner GlcNAc; Ax,
number of antennas (GlcNAc) on trimannosyl core; Gx, number of
β1-4 linked galactoses on antenna; [6]G1
indicates that the galactose is on the antenna of the α1-6
mannose; Sx, number (x) of sialic acids linked to galactose. Structures
in each peak were derived according to [9].
SDS concentration in the deglycosylation reaction (F02) showed significant positive effect on all the above-mentioned glycan peak areas, and volume of H2O for glycan elution (F07) showed significant positive effect on later eluting (more hydrophilic) glycan peak areas, which means that high values of these factors are better in terms of intensity of designated peaks. Igepal concentration in the deglycosylation reaction (F03) and number of washing steps (F05) showed significant negative effect in all above-noted glycan peak areas, which means that low values of these factors are more favorable. Strangely, volume of initial plasma sample (F01) showed significant negative effect on GP1 and GP4, and significant positive effect on GP14, GP20, and GP30. To elucidate this further, we examined the effect of each factor on CVs of relative percentage area (not shown). Volume of initial sample and concentration of SDS had the largest effect on neutral glycans – both in case of 5 and 10 µl of initial plasma sample, lower CVs were obtained when higher concentration of SDS was used (0.8% w/v), with the best results for 5 µl of sample and 0.8% (w/v) SDS. This could be an indication of selective glycan loss inside protein precipitate in the case when there is not enough SDS to keep it denatured.
The optimized conditions that were used in further experiments were therefore: 5 µl of plasma sample, 0.8% (w/v) SDS, 0.8% (v/v) Igepal, five washing steps after application of sample on GHP filter, and elution with 2 × 100 µl of H2O. Incubation time of sample on GHP filter was not shown to be significant, so we decided to use shorter incubation of 5 min. Also, the robustness experiment showed that shorter incubation time with H2O before elution of glycans from GHP filter was slightly better than 15 min incubation. However, in our experience shorter incubation times can sometimes lead to lower intensities, due to poorer glycan recovery, so we decided to use longer incubation.
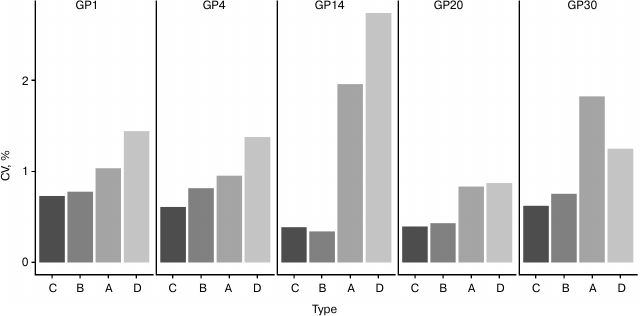
Method validation. Next, we wanted to determine if any major step in sample preparation introduces higher variation than any other step and potentially requires further optimization, so we prepared technical replicates of one sample that were pooled in different time points to remove the variation of previous steps (n = 24 replicates for each time point). The results showed that variation in relative percentage area values noticeably decreases between steps A and B, implying that the labeling step introduces the largest variation, since A contains variation of labeling, clean-up, and UPLC run, while B contains variation of clean-up and UPLC run (Fig. 3). The labeling reaction theoretically could be improved by prolonging the incubation time or using higher temperature. However, when sialylated glycans are present in the sample, longer incubation times and higher temperatures lead to desialylation [12], so 2 h at 65°C incubation is a trade-off between incomplete labeling and desialylation. An additional option is to increase the concentration of label and/or volume of labeling mixture. However, this would require deviation from the existing sample preparation method, which was selected for maximal reproducibility.
Fig. 3. Analysis of source of variation in developed sample preparation method for plasma N-glycan UPLC analysis. Only major glycan peaks of different structural complexity were shown (refer to Table 2 for most abundant structures). Samples were pooled in different steps: A, after deglycosylation; B, after labeling; C, after clean-up; D, samples were not pooled at any step. CVs of relative percentage area are shown, n = 24 for each sample type.
Since large cohorts are analyzed on UPLC during several days, even weeks, we wanted to check whether there is any difference between samples that were analyzed on different days (in different sample sets). We prepared one whole plate (96 samples) of the single plasma sample, pooled all samples after clean-up procedure to remove variation due to the sample preparation, and aliquoted the pool into the clean plate (96 samples). These samples were analyzed in three sets consecutively (32 samples in each) during the period of three days and showed excellent standard deviations: 17 out of 39 peaks had CVs below 1% (constitute the average % area of 81.3%), 14/39 up to 2% (average % area of 15.4%), 5/39 up to 3% (average % area of 2.5%), and only 3/39 peaks had CVs up to 4% (average % area of 0.8%).
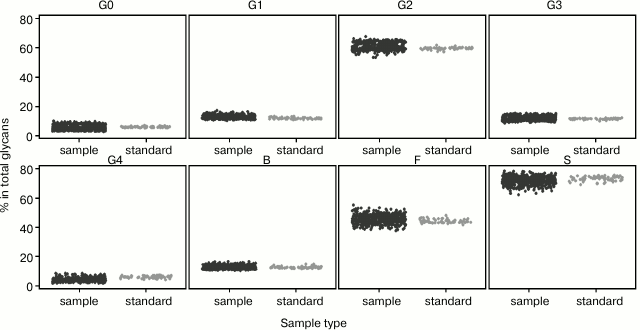
It is essential that high-throughput method gives the same results in different time points since, by its definition, it implies that a large number of samples are being analyzed in every study. Also, it should not be affected by the person who is preparing the samples. To validate developed and optimized the high-throughput method in terms of variation of days and analysts, three analysts prepared one 96-well plate of samples each on two different days (three weeks apart). We systematized 39 plasma N-glycan peaks into eight major groups: agalactosylated (G0), monogalactosylated (G1), digalactosylated (G2), trigalactosylated (G3), tetragalactosylated (G4), fucosylated (F), bisected (B), and sialylated (S) glycans according to most abundant structures in each peak (Table 3) [9]. To elucidate the biological variability among ten healthy adults in three time points, we calculated the percentage of each of those eight groups of glycans in total plasma N-glycome for each sample. The same was done for standard samples from all six plates to determine the reproducibility of the developed sample preparation method (Fig. 4). It can be seen that the biological variation of major groups of plasma glycans inside the population of healthy individuals in their thirties and forties is relatively high, and the developed sample preparation method could be used for detection of changes in plasma N-glycome composition due to its robustness, even when samples are prepared on different days and by different analysts.
Table 3. Major groups of plasma
N-glycans
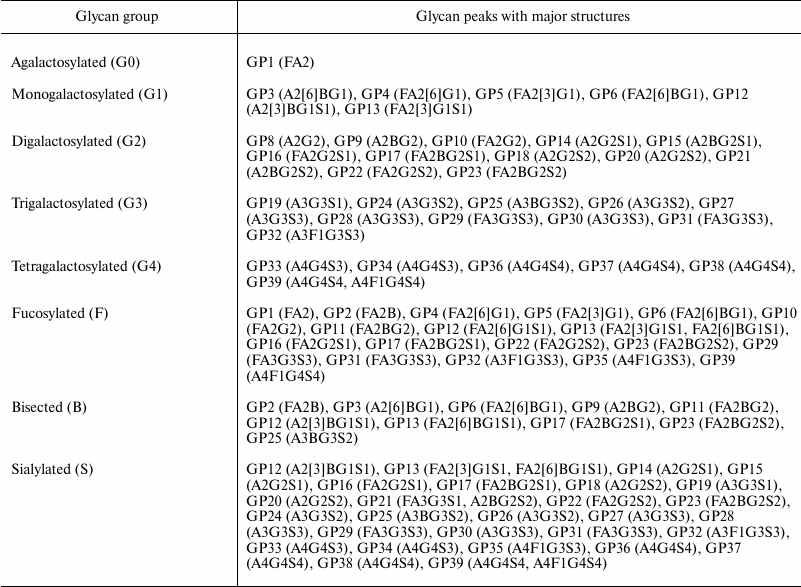
Notes: Thirty nine peaks (GP1-GP39, Fig. 1) were
systematized into agalactosylated (G0), monogalactosylated (G1),
digalactosylated (G2), trigalactosylated (G3), tetragalactosylated
(G4), fucosylated (F), bisected (B), and sialylated (S) glycans
according to most abundant structures in each peak [9]. Abbreviations: all N-glycans have core
sugar sequence consisting of two N-acetylglucosamines (GlcNAc) and
three mannose residues; F indicates a core fucose α1-6 linked to
the inner GlcNAc; Mx, number (x) of mannoses on core GlcNAc; Ax, number
(x) of antennas (GlcNAc) on trimannosyl core; Gx, number (x) of
β1-4 linked galactoses on antenna; Sx, number (x) of sialic acids
linked to galactose.
Fig. 4. Biological variation of major groups of plasma N-glycans (agalactosylated (G0), monogalactosylated (G1), digalactosylated (G2), trigalactosylated (G3), tetragalactosylated (G4), fucosylated (F), bisected (B), and sialylated (S), according to Table 3) inside the population of healthy individuals (sample, black), and reproducibility of developed sample preparation method (standard, gray). Percentage of each group of glycans in total plasma N-glycome is shown.
To support the development of high-throughput approaches in studying glycosylation in large cohorts, here we described the development, optimization, and validation of a sample preparation method for plasma N-glycan UPLC analysis that is reproducible, fast, cost-effective, and robust. We demonstrated the potential of the method to detect biological variation in plasma N-glycome among individuals with very good reproducibility during a month time. Therefore, a high number of samples can be analyzed in longer periods of time without introducing too much variability due to the method itself.
Research reported in this publication was supported by the European Commission FP7 projects HTP-GlycoMet (contract No. 324400), IBD-BIOM (contract No. 305479) and PainOmics (contract No. 602736).
REFERENCES
1.Gornik, O., and Lauc, G. (2008) Glycosylation of
serum proteins in inflammatory diseases, Dis. Markers,
25, 267-278.
2.Ohtsubo, K., and Marth, J. D. (2006) Glycosylation
in cellular mechanisms of health and disease, Cell, 126,
855-867.
3.Huffman, J. E., Pučić-Baković,
M., Klarić, L., Hennig, R., Selmane, M. H. J.,
Vučković, F., Novokmet, M., Krištić, J.,
Borowiak, M., Muth, T., Polašek, O., Razdorov, G., Gornik, O.,
Plompe, R., Theodoratou, E., Wright, A. F., Rudan, I., Hayward, C.,
Campbell, H., Deelder, A. M., Reichl, U., Aulchenko, Y. S., Rapp, E.,
Wuhrer, M., and Lauc, G. (2014) Comparative performance of four methods
for high-throughput glycosylation analysis of immunoglobulin G in
genetic and epidemiological research, Mol. Cell Proteom.,
13, 1598-1610.
4.Royle, L., Campbell, M. P., Radcliffe, C. M.,
White, D. M., Harvey, D. J., Abrahams, J. L., Kim, Y. G., Henry, G. W.,
Shadick, N. A., Weinblatt, M. E., Lee, D. M., Rudd, P. M., and Dwek, R.
A. (2008) HPLC based analysis of serum N-glycans on a 96-well
plate platform with dedicated database software, Anal. Biochem.,
376, 1-12.
5.Burnina, I., Hoyt, E., Lynaugh, H., Li, H., and
Gong, B. (2013) A cost-effective plate-based sample preparation for
antibody N-glycan analysis, J. Chromatogr. A,
1307, 201-206.
6.Stöckmann, H., Adamczyk, B., Hayes, J., and
Rudd, P. M. (2013) Automated, high-throughput IgG-antibody
glycoprofiling platform, Anal. Chem., 85, 8841-8849.
7.Pučić, M., Pinto, S., Novokmet, M.,
Knežević, A., Gornik, O., Polašek, O.,
Vlahoviček, K., Wang, W., Rudd, P. M., Wright, A. F., Campbell,
H., Rudan, I., and Lauc, G. (2010) Common aberrations from the normal
human plasma N-glycan profile, Glycobiology, 20,
970-975.
8.Pučić, M., Mužinić, A.,
Novokmet, M., Škledar, M., Pivac, N., Lauc, G., and Gornik, O.
(2012) Changes in plasma and IgG N-glycome during childhood and
adolescence, Glycobiology, 22, 975-982.
9.Saldova, R., Shehni, A. A., Haaksen, V. D.,
Steinfeld, I., Hilliard, M., Kifer, I., Helland, Å., Yakhini, Z.,
Børresen-Dale, A.-L., and Rudd, P. M. (2014) Association of
N-glycosylation with breast carcinoma and systemic features
using high-resolution quantitative UPLC, J. Proteome Res.,
13, 2314-2327.
10.Novokmet, M., Pučić, M.,
Redžić, I., Mužinić, A., and Gornik, O.
(2012) Robustness testing of the high throughput HPLC-based analysis of
plasma N-glycans, Biochim. Biophys. Acta, 1820,
1399-1404.
11.Reusch, D., Haberger, M., Maier, B., Maier, M.,
Kloseck, R., Zimmermann, B., Hook, M., Szabo, Z., Tep, S., Wegstein,
J., Alt, N., Bulau, P., and Wuhrer, M. (2015) Comparison of methods for
the analysis of therapeutic immunoglobulin G Fc-glycosylation profiles.
Part 1. Separation-based methods, mAbs, 7, 167-179.
12.Bigge, J. C., Patel, T. P., Bruce, J. A.,
Goulding, P. N., Charles, S. M., and Parekh, R. B. (1995) Nonselective
and efficient fluorescent labeling of glycans using 2-aminobenzamide
and anthranilic acid, Anal. Biochem., 230, 229-238.
