Lag Phase of CO2-Dependent O2 Evolution by Illuminated Anabaena variabilis Cells
V. D. Samuilov* and T. A. Fedorenko
Department of Cell Physiology and Immunology, School of Biology, Lomonosov Moscow State University, Moscow, 119899 Russia; fax: (095) 939-3807* To whom correspondence should be addressed.
Received December 19, 1998
The steady-state rate of CO2-dependent O2 evolution by Anabaena variabilis cells in response to illumination was established after a lag phase. The lag phase was shortened (1) in cells incubated with glucose as an oxidizable substrate and (2) upon an increase in light intensity. The lag phase was absent during electron transfer from H2O to p-benzoquinone (in combination with ferricyanide) involving Photosystem II. A lag was observed during electron transfer from H2O to methyl viologen involving Photosystems II and I, but not for electron transfer from N,N,N',N'-tetramethyl-p-phenylenediamine (in combination with ascorbate) to methyl viologen involving only Photosystem I. The lag phases of the light-induced H2O --> CO2 and H2O --> methyl viologen electron transfer reactions showed the same temperature dependences at 10-30°C. The lag was prevented by 3-(3,4-dichlorophenyl)-1,1-dimethylurea at concentrations that caused partial inhibition of photosynthetic O2 evolution. Retardation of cell respiration by a combination of CN- and benzylhydroxamate shortened the lag phase of the H2O --> methyl viologen electron transfer. It is concluded that the lag phase is associated with the electron transfer step between Photosystem II and Photosystem I common for the photosynthetic and respiratory chains and is due to the stimulation of cell respiration during the initial period of illumination as a consequence of an increase in the reduced plastoquinone pool and to subsequent retardation of respiration resulting from the transition of the electron transfer chain to the competitive pathway involving Photosystem I.
KEY WORDS: photosynthesis and respiration, O2 evolution, lag phase, b6f complex, plastocyanin, Photosystem I, cyanobacteria, Anabaena variabilis
The rate of CO2-dependent O2 evolution by cyanobacteria upon illumination attains a steady-state level after a lag phase [1]. The delay in photosynthetic O2 evolution is abolished by artificial electron acceptors supporting the Hill reaction (p-benzoquinone, N,N,N',N'-tetramethyl-p-phenylenediamine (TMPD), 2,3,5,6-tetramethyl-p-phenylenediamine (DAD), and 2,6-dichlorophenolindophenol) added in combination with ferricyanide [1]. The lag phase and the steady-state level of O2 evolution by Anabaena variabilis cells are subject to regulation by the surface charge of the thylakoid membranes [1].
CO2-Dependent O2 evolution by isolated spinach [2] and pea [3] chloroplasts is also characterized by a lag phase presumably resulting from the superposition of two concomitant processes: 1) O2 evolution upon H2O oxidation, and 2) O2 uptake in the ferredoxin-dependent Mehler reaction under NADP+ deficiency [2]. NADP+ deficiency at the initial stage of illumination is due to an imbalance between ATP synthesis and NADP+ reduction. The ATP/NADPH ratio of 1.5 is optimal for CO2 photoassimilation; a lack of ATP causes the inhibition of CO2 uptake and the accumulation of NADPH; this results in NADP+ deficiency, which causes accumulation of reduced ferredoxin. Ferredoxin is spontaneously oxidized by O2, thereby initiating pseudocyclic electron transfer coupled with photophosphorylation. The subsequent increase in the ATP/NADPH ratio brings about NADPH oxidation and, therefore, abolishes the NADP+ deficiency, suppresses ferredoxin-dependent O2 evolution, and enhances photosynthetic O2 evolution [2]. Steady-state photosynthesis in an intact sunflower leaf proceeds following a number of oscillations in the redox state of the primary electron acceptor QA of Photosystem II, the P700 reaction center of Photosystem I, the ATP/ADP ratio, and the rate of CO2 consumption [4].
This mechanism of the lag phase [2] is consistent with data on the effect of uncouplers of photophosphorylation [1, 3, 5]. Gramicidin D or the combination of valinomycin and nigericin suppressed light-induced generation of DeltapH in intracellular thylakoids as estimated by the quenching of 9-aminoacridine fluorescence, increased the lag phase [1], and inhibited photosynthetic O2 evolution [5] by A. variabilis cells. Similar effects on the lag phase and the rate of CO2-dependent O2 evolution were produced by NH4Cl and carbonyl cyanide p-trifluoromethoxyphenylhydrazone in chloroplasts [3].
However, these data cannot be interpreted unambiguously because tested agents, including gramicidin D, nigericin, the combination of valinomycin and nigericin, NH4Cl, and carbonyl cyanide m-chlorophenylhydrazone were to a similar extent inhibitory to the Hill reaction with p-benzoquinone, TMPD, or DAD in A. variabilis cells [5]. Since the channel-forming agent gramicidin D allows H+ and alkaline metal cations to penetrate membranes, it can disrupt Na+-dependent bicarbonate transfer into cyanobacterial cells [6-9]. A similar influence can be exerted by nigericin and its combination with valinomycin because these ionophoric antibiotics, despite their high affinity for K+, can also transfer Na+ across membranes. Disrupting bicarbonate transfer can suppress electron flow not only at the Photosystem I level (due to lack of CO2 as the terminal electron acceptor in the photosynthetic chain), but also at the level of the ferroquinone complex of the electron-acceptor branch of Photosystem II [10-12]. Moreover, the resulting change in the ion status of cyanobacterial membranes suppresses the activity of the Na+-dependent Cl- transporter [13]; Cl- is involved in photosynthetic water oxidation [14]. As for carbonyl cyanide phenylhydrazone derivatives, these compounds are ADRY reagents, i.e., they cause the relaxation of the S states of the water-oxidizing complex and suppress photosynthetic O2 evolution [15, 16]. Inhibition of photosynthetic O2 evolution by ammonium is due to its action as a Lewis base: it substitutes for H2O and other ligands of the Mn cluster of the water-oxidizing complex [14]. Ammonium produces multiple effects on the water-oxidizing complex, which contains several NH3 binding sites [14].
The intricate pattern of the initial stage of photosynthetic O2 evolution is of considerable interest in terms of the kinetics of enzyme reactions. As a rule, the initial stage of enzyme reactions are characterized by maximal rate because the enzymes are substrate-saturated and not loaded by reaction products. Since photosynthetic O2 evolution is the final result of a large number of electron transport reactions (involving the water-oxidizing complex, Photosystem II, the b6f cytochrome complex, Photosystem I, and low-molecular-weight electron carriers), the lag phase may reflect the operation of regulatory mechanisms of the overall process. For example, the NADH:ubiquinone oxidoreductase complex (complex I) of the respiratory chain is also characterized by a lag phase in the NADH oxidation reaction (reviewed, [17]). This is because the enzyme can exist in active and inactive forms. Adding NADH to submitochondrial particles results in a slow conversion of the inactive form into the active form.
Also, the lag phase could be due to the interaction of the photosynthetic (O2 evolution) and the respiratory (O2 uptake) electron transfer chains. They are both located in the thylakoid membranes of cyanobacteria (reviewed in [18]). The membrane plastoquinone pool, the b6f complex, and plastocyanin (or cytochrome c6) are involved in both the photosynthetic and the respiratory electron transfer [18, 19]. There is evidence that respiration is suppressed upon illumination in a number of cyanobacteria [20-23]. From these data, the conclusion was drawn that the terminal link of the respiratory chain, a cytochrome oxidase of the aa3 type [18], becomes non-functional in the light. The inhibitory effect of light results from the competition between the cytochrome oxidase and Photosystem I for electrons [20-23]. Some data argue against this conclusion. Significant respiration-dependent O2 uptake by the thylakoid membranes of the cyanobacterium Oscillatoria chalybea occurs only at high light intensity with maximal Photosystem I activity [24]. However, this effect might be due to Photosystem I-dependent O2 uptake (the Mehler reaction) rather than respiration.
Chloroplast membranes of unicellular green algae [25, 26] and higher plants [27, 28] exhibit a kind of respiratory activity termed chlororespiration. Isolated potato chloroplasts show rotenone-resistant NAD(P)H:plastoquinone oxidoreductase activity. This process differs from the ferredoxin:NADP+ reductase and the ferredoxin:plastoquinone reductase reactions in terms of its sensitivity to inhibitors [29]. The chloroplast genome contains transcribed genes homologous to those of the mitochondrial NADH:ubiquinone oxidoreductase. Seven genes are homologs of mitochondrial genes, and four of nuclear genes [30]. Data on light-dependent O2 uptake by tobacco chloroplasts, estimated by mass spectrometry during 18O2 exchange, indicate that the membrane plastoquinone pool is shared by the photosynthetic and the chlororespiratory electron transfer chains [28].
Hence, the data available in the literature suggest that there is no consensus concerning the reason for the lag phase in photosynthetic oxygen evolution. The goal of this work was to characterize the parameters of the lag phase, to investigate the link of the electron transfer chain responsible for it, and to elucidate the reason for the lag phase.
MATERIALS AND METHODS
Anabaena variabilis Kütz No. 458 cells were cultivated phototrophically on Kratz--Meyers “C” medium as described earlier [1]. Cells of 2-3-day-old cultures (corresponding to the exponential growth stage) were collected by centrifugation at 3,000-5,000g for 5 min, washed with a solution containing 20 mM Tricine-NaOH (pH 7.6) and 10 mM NaCl, resuspended in a small volume of the same solution, stored at room temperature in the dark, and used in studies within 3-5 h after washing. The chlorophyll content in the cells was determined by extraction with acetone at a final concentration of 80% using the extinction coefficient of 60 mM-1·cm-1 at 675 nm [31]. Evolution and uptake of O2 was measured with a closed Clark-type platinum electrode. The incubation medium of the cells (chlorophyll concentration 5-8 µg/ml) contained Tricine-NaOH (pH 7.6) and 10 mM NaCl. The cells were illuminated with white light of saturating intensity (~0.1 W/cm2). The rates of CO2-dependent O2 evolution and methyl viologen-dependent O2 uptake at saturating light intensity were 90-120 µmoles/h per mg chlorophyll. The average respiration rate of dark-incubated cells was 3-3.5 times lower than the rate of photosynthetic O2 evolution (calculated per mg chlorophyll). The cells were dark-preincubated for 20 to 30 min before measuring the duration of the lag phase. The influence of various agents on photosynthesis and respiration was investigated after preincubating the cells with these agents for 15 min in the dark.
RESULTS AND DISCUSSION
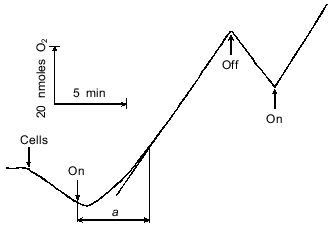
Dark-incubated A. variabilis cells took up O2 (Fig. 1). This process is due to the oxidation of intracellular substrates (endogenous respiration) [23]. After initiation of illumination, the cells evolved O2. This process depended on CO2 and ceased after CO2 was depleted [1]. The steady-state rate of CO2-dependent O2 evolution was achieved after a lag phase (Fig. 1). The duration of the lag phase was determined as the time interval between the beginning of the illumination and the attaining of the steady-state rate of O2 evolution (Fig. 1, segment a). Depending on the state of the cells and the experimental conditions, the duration of the lag phase varied within the range of 0.5 to 5 min or more.
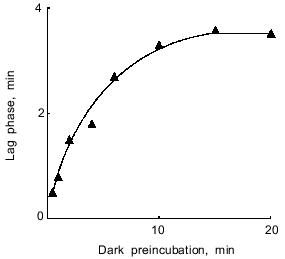
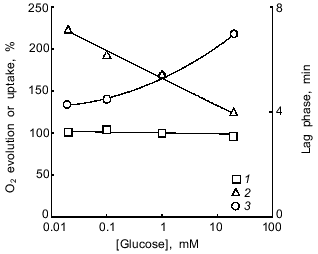
The duration of the lag phase depended on the time of dark preincubation and attained maximal value after incubating the cells for at least 10-15 min in the dark (Fig. 2). Glucose stimulated respiration, produced no effect on the steady-state rate of photosynthetic O2 evolution, and reduced the lag phase (Fig. 3). Based on these data, the lag phase is likely to reflect an interaction between the photosynthetic and respiratory electron transfer chains. The question to be raised, therefore, concerns the impact of the state of the photosynthetic chain (whose turnover rate can be adjusted by changing the intensity of actinic light) on the lag phase.Fig. 1. CO2-Dependent O2 evolution by illuminated A. variabilis cells. On and Off, initiation and cessation of illumination.
Fig. 2. Lag phase of CO2-dependent O2 evolution by A. variabilis cells as a function of the time of dark preincubation of the cells.
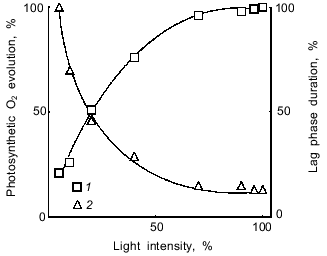
The rate of O2 evolution increased with an increase in light intensity, whereas the duration of the lag phase significantly decreased (Fig. 4). If the lag phase results from the competition of cytochrome oxidase--Photosystem I for Photosystem II-donated electrons (see introductory section), then the data of Fig. 4 indicate that the lag phase increases when Photosystem I becomes a weak competitor (low light intensity) for the O2-consuming cytochrome oxidase. Conversely, if Photosystem I is a strong competitor (high light intensity), the lag phase of O2 evolution is comparatively short. The point to clarify is whether the enhancement of the competitive influence of Photosystem I is caused by overcoming the NADP+ shortage by increasing the ATP/NADPH ratio as proposed in [2-4] to explain the mechanism of the lag phase (see introductory section).Fig. 3. Effect of glucose on the steady-state rate (1) and the duration of the lag phase (2) of CO2-dependent O2 evolution by illuminated A. variabilis cells and on their dark respiration (3). 100%, values measured without exogenous glucose.
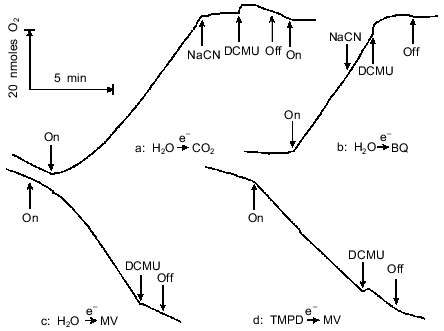
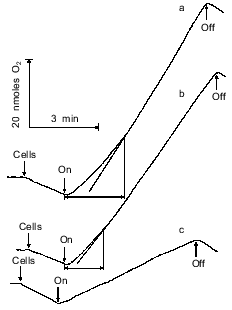
Thus, we investigated the effects of various electron donors and acceptors. It had been shown earlier [1] that p-benzoquinone, TMPD, DAD, and 2,6-dichlorophenolindophenol added in combination with ferricyanide abolish the lag phase during light-dependent O2 evolution by cells of A. variabilis and of a number of other cyanobacteria. In agreement with [1], the lag phase was abolished by p-benzoquinone as electron acceptor in the Hill reaction (compare Figs. 5a and 5b). CN- (1 mM) suppressed CO2-dependent O2 evolution (Fig. 5a) but had no effect on the Hill reaction with p-benzoquinone (Fig. 5b). CN- is known to inhibit CO2 fixation [32] by suppressing ribulose 1,5-bisphosphate carboxylase activity [33]. At concentrations exceeding 5-10 mM, CN- suppresses the Hill reaction [34] and decreases the activities of plastocyanin [35] and the water-oxidizing complex [36, 37].Fig. 4. Dependence of the rate (1) and the duration of the lag phase (2) of CO2-dependent O2 evolution of A. variabilis cells on light intensity. 100% values of the rate of O2 evolution and the lag phase duration were 93 µmoles/h per mg chlorophyll and 3.1 min, respectively.
In subsequent studies we used methyl viologen as electron acceptor in the Hill reaction characterized by electron transfer from H2O to methyl viologen involving Photosystems I and II. Methyl viologen is predominantly reduced by the FeS center FB and, less efficiently, by the FeS center FA of the electron-acceptor complex of Photosystem I [38]. The reduced methyl viologen is then non-enzymatically reoxidized by O2, yielding the superoxide anion radical O2, which is converted to H2O2 by superoxide dismutase. Catalase-dependent decomposition of H2O2 was prevented by preincubating the cells with CN-, a catalase inhibitor. The net result of the O2 exchange reactions involving methyl viologen (MV) is illustrated by the following equations:Fig. 5. Light-induced O2 evolution and uptake by A. variabilis cells: a) O2 evolution with CO2 as electron acceptor; b) O2 evolution with 100 µM p-benzoquinone (BQ) and 3 mM ferricyanide as electron acceptor system; c) O2 uptake with 1 mM methyl viologen (MV) as electron acceptor in the presence of 1 mM NaCN; d) O2 uptake with 1 mM MV as electron acceptor and 100 µM N,N,N',N'-tetramethyl-p-phenylenediamine (TMPD) plus 5 mM sodium ascorbate as electron donor system, in the presence of 10 µM DCMU and 1 mM NaCN. The cells were dark-preincubated for 15 min in all four variants. Additions: 1 mM NaCN and 10 µM DCMU.
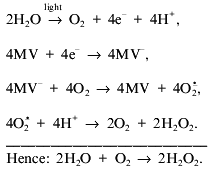
From the above equations it follows that, given the same light intensity, the rate of O2 uptake with methyl viologen should equal that of O2 evolution with CO2. This was actually found in most experiments.
A lag phase is characteristic of both CO2-dependent light-induced O2 evolution and light-induced O2 uptake with methyl viologen by A. variabilis cells (Fig. 5c). 3-(3,4-Dichlorophenyl)-1,1-dimethylurea (DCMU), which inhibits electron transfer between the primary (QA) and the secondary (QB) plastoquinones, suppressed O2 evolution with CO2 or p-benzoquinone and O2 uptake with methyl viologen. Figure 5d shows O2 uptake by illuminated cells associated with electron transfer from ascorbate-reduced TMPD to methyl viologen (involving Photosystem I; Photosystem II is blocked by DCMU). It is evident that the TMPD --> methyl viologen electron transfer proceeds without any lag.
Hence, the lag phase occurs during electron transfer from H2O to CO2 and from H2O to methyl viologen (involving both Photosystems and the b6f complex) but not during electron transfer from water to p-benzoquinone (the Hill reaction, chiefly dependent on Photosystem II, with minor involvement of the system including both Photosystems and the b6f complex) or from TMPD to methyl viologen (involving Photosystem I only). The lag phase therefore seems to be due to the operation of the part of the electron transfer chain located between Photosystems I and II (membrane pool plastoquinone QP--b6f complex--plastocyanin and/or cytochrome c6) common to the photosynthetic and the respiratory chains.
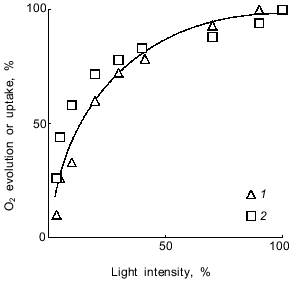
An objection to be raised to this statement is that the lag phase with methyl viologen is due not to the electron transfer reactions in the photosynthetic chain, but to rate-limiting steps required for delivering methyl viologen to the site of its reduction (the consecutive steps of methyl viologen transfer across the bacterial cell wall and the cytoplasmic membrane and methyl viologen delivery to the thylakoid membranes and to the relevant part of the electron-acceptor branch of Photosystem I). However, Fig. 6 demonstrates that CO2-dependent O2 evolution and methyl viologen-dependent O2 uptake are virtually indistinguishable with respect to their dependence on the intensity of actinic light. If the electron transfer were rate-limited by methyl viologen transport into bacterial cells and, subsequently, to the photoreduction site, then O2 uptake would be light-saturated at lower light intensities than CO2-dependent O2 evolution.
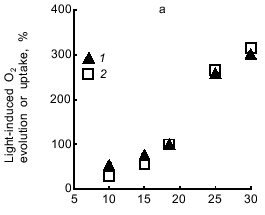
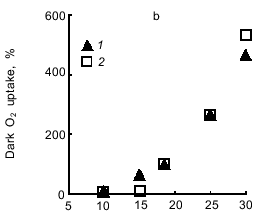
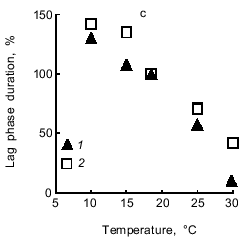
Light-induced O2 evolution with CO2 and O2 uptake with methyl viologen are characterized by the same temperature dependence (Fig. 7a). Methyl viologen did not affect the temperature dependence of the respiration of dark-incubated cells (Fig. 7b). While the rate of photosynthesis and respiration increased with temperature increasing from 10 to 30°C, the lag phase in the photosynthetic electron transfer from H2O to CO2 or methyl viologen significantly decreased. The same temperature dependence was characteristic of electron transfer to both acceptors (Fig. 7c).Fig. 6. Dependence of the rate of O2 evolution with CO2 (1) and O2 uptake with methyl viologen (2) by A. variabilis cells on the intensity of actinic light. In experiment 2 the cells were preincubated for 15 min with 1 mM NaCN and 1 mM methyl viologen.
Now we address the question of the nature of the lag phase of photosynthetic O2 evolution. Why does the rate of O2 evolution, which is low during the initial period of illumination, gradually increase and after some time reach a steady-state value? Slow O2 evolution may be due to: 1) the inability of Photosystem I to function at full output in the noncyclic mode of electron transfer from Photosystem II during the initial period of illumination, and, as a consequence, 2) stimulation of cell respiration compared to that before illumination because the concentration of endogenous oxidizable substrate (the membrane pool of reduced plastoquinone QPH2) increases under illumination; thus, O2 uptake resulting from plastoquinone oxidation via the respiratory chain will be compensated by equimolar O2 evolution due to the H2O --> plastoquinone electron transfer involving Photosystem II. This is consistent with the data showing that the Hill reaction proceeds without a lag phase (Fig. 5b): the p-benzoquinone--ferricyanide combination oxidizes QPH2, as indicated by the fact that cell respiration ceases in the dark. This is also compatible with the data showing that respiration of methyl viologen-incubated cells does not accelerate immediately after initiating the illumination (Fig. 5c, see also Fig. 9).Fig. 7. Temperature dependence of photosynthesis and respiration of A. variabilis cells: a) light-induced O2 evolution with CO2 (1) and O2 uptake with methyl viologen (2); b) dark endogenous respiration of A. variabilis cells without (1) and with (2) methyl viologen; c) lag phase of light-induced O2 evolution with CO2 (1) and O2 uptake with methyl viologen (2). In variant 2 of all the experiments the cells were preincubated for 15 min with 1 mM NaCN and 1 mM methyl viologen. The 100% values (measured at 18°C) were as follows: light-induced O2 evolution and uptake, 94.5 and 69 µmoles/h per mg chlorophyll; respiration rates with and without methyl viologen, 27 and 36 µmoles O2/h per mg chlorophyll, respectively; duration of the lag phase of O2 evolution with CO2 and O2 uptake with methyl viologen, 5 and 6 min, respectively.
If our suggestion is valid, then (e.g., DCMU-induced) inhibition of QP photoreduction is expected to shorten or completely abolish the lag phase. Low DCMU concentrations causing incomplete suppression of photosynthetic O2 evolution actually prevented the lag phase by decreasing the number of electrons accepted by QP (Fig. 8). Under these conditions, the competitive interaction of Photosystem I and cytochrome oxidase results in the dominance of Photosystem I because the operation of cytochrome oxidase is not promoted by an increase in the concentration of oxidizable substrate (compared with its dark concentration maintained before illumination). Based on the rates of O2 evolution (250 µmoles O2/h per mg chlorophyll without DCMU and 109 µmoles O2/h per mg chlorophyll with 10-7 M DCMU), the number of functionally active Photosystem II complexes providing the plastoquinone pool with reducing equivalents decreased more than twofold. The number of functionally active Photosystem I complexes did not change, and they succeeded in processing the residual QPH2, winning the competition with the O2-consuming cytochrome oxidase, shifting the overall balance of O2 exchange towards O2 evolution, and in so doing preventing the lag phase.
Presumably, the lag phase during the H2O --> methyl viologen electron transfer should also be reduced upon decelerating cell respiration, if it really competes with Photosystem I activity. A curious point is that light-dependent O2 uptake with methyl viologen is monitored in the presence of CN-, a catalase inhibitor. However, CN- also blocks cytochrome oxidase. Therefore, no competition should occur in CN--treated cells.Fig. 8. Effect of DCMU on the rate and lag phase of CO2-dependent O2 evolution by illuminated A. variabilis cells: a) no additions; b) 2.5·10-8 M DCMU; c) 10-7 M DCMU. The cells were preincubated with DCMU for 15 min.
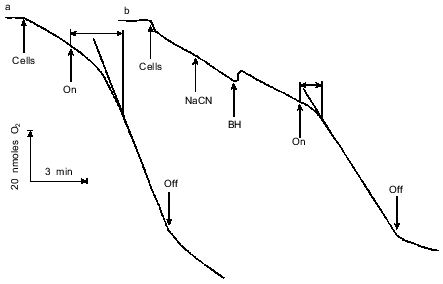
In fact, CN- only partially inhibits the respiration of A. variabilis cells [23]. The rate of endogenous cell respiration was 15-20% decreased by 0.5 mM CN- in our studies; the level of inhibition did not increase upon increasing the CN- concentration to 5 mM (data not shown). Figure 9 shows that adding CN- to methyl viologen-preincubated cells slightly stimulates O2 consumption, obviously due to the inhibition of catalase (O2 consumption in the dark is caused not only by cell respiration, but also by oxidation of methyl viologen, which is reduced with the involvement of cell dehydrogenases). Benzylhydroxamate inhibits an alternative CN--resistant oxidase [23]. However, even the CN---benzylhydroxamate combination fails to completely suppress O2 consumption by cells in the dark [23]. The residual respiration amounts to 30% or more of the uninhibited rate. Light-induced O2 uptake by cells incubated with CN-, benzylhydroxamate, and methyl viologen is characterized by a lag phase which is considerably shorter than that without benzylhydroxamate (Fig. 9, compare curves a and b). Hence, decreasing cell respiration reduces the lag phase of H2O --> methyl viologen electron transfer without a significant effect on the steady-state rate of the process (Fig. 9).
A question to raise is why Photosystem I cannot operate at full output (with the maximum turnover number) in the noncyclic mode during the initial period of illumination. Why does the establishment of the state with the maximal turnover number take so much time?Fig. 9. Effect of NaCN and benzylhydroxamate on methyl viologen-dependent O2 uptake by illuminated A. variabilis cells: a) cells preincubated for 15 min with 1 mM methyl viologen and 1 mM NaCN in the dark; b) cells preincubated for 15 min with 1 mM methyl viologen in the dark. Additions: 1 mM NaCN and 5 mM benzylhydroxamate (BH).
Attempts have been made to answer this question by postulating the involvement of CO2 photoassimilation-linked reactions based on the operation of ribulose 1,5-bisphosphate carboxylase. These reactions overcome the shortage of the ATP available for CO2 photoassimilation (via the cyclic phosphorylation pathway in Photosystem I), which is limited by a deficiency of NADP+, since NADP+ is reduced and the accumulating reduced ferredoxin is oxidized by oxygen [2-4]. However, this explanation not correct because a similar lag phase occurs with CO2 as the electron acceptor and with methyl viologen, whose reduction cannot depend on the ATP/ADP ratio.
Light-dependent adaptive changes in the distribution of the energy of electron excitation between Photosystems I and II are characteristic of higher and lower plants and of cyanobacteria. These changes are referred to as transitions between state 1 and state 2 of the photosynthetic apparatus (reviewed in [39]). In state 1, the energy of electron excitation is predominantly used by Photosystem II, and this state is attained under oxidizing conditions. State 2 is characterized by preferential excitation of Photosystem I, and it occurs if the membrane plastoquinone pool is reduced [40]. The transition to state 2 in plants is due to phosphorylation of the chlorophyll a/b--protein complex of the light-harvesting antenna, and transition to state 1 is due to its dephosphorylation [39]. Phosphorylation of chloroplast proteins is catalyzed by a kinase activated during the interaction of the plastoquinol--b6f cytochrome complex [40]. Reversible protein phosphorylation during the state 1 <-> state 2 transitions also occurs in the thylakoid membranes of cyanobacteria [41]. These transitions are subject to regulation by the respiratory chain [39, 42]. Presumably, the lag phase during O2 exchange can result from the light-induced transition of the photosynthetic machinery from state 2 to state 1.
Photosynthetic O2 evolution by the cyanobacterium Anacystis nidulans is more sensitive to inhibitors (N,N'-dicyclohexylcarbodiimide and tributyltin chloride) and the uncoupler carbonyl cyanide m-chlorophenylhydrazone than the state 2 --> state 1 transition as monitored by measuring chlorophyll fluorescence [43]. Similar data were obtained with isolated pea chloroplasts [3]: the uncouplers carbonyl cyanide p-trifluoromethoxyphenylhydrazone and NH4Cl were more efficient in inhibiting CO2-dependent O2 evolution than in converting state 1 to state 2 (based on measurements of ATP-dependent phosphorylation of proteins of the light-harvesting antenna). The lag phase during CO2-dependent O2 evolution and the transition to state 2 were kinetically distinguishable processes [3].
Activation of Photosystem I caused by the transition of the photosynthetic apparatus from state 1 to state 2 can be partially responsible for the subsequent change in the O2 exchange equilibrium, favoring oxygen evolution rather than oxygen uptake resulting from respiration. However, the transition to state 2 cannot be the main (or the only) factor determining the lag phase, since the parameters of this transition do not match those of the lag phase based on the results of the inhibitor assay and the kinetic studies [3, 43] discussed above. In addition, the lag phase should also occur during electron transfer from TMPD to methyl viologen, involving Photosystem I. By reacting with the dehydrogenases of the respiratory chain, methyl viologen can prevent QP reduction. TMPD cannot reduce QP, since the E0´ value of TMPD is 240 mV [44]; E0´ of the plastoquinone/plastohydroquinone couple in 80% ethanol is 110 mV [45]. Apart from the noncyclic TMPD --> methyl viologen --> O2 electron transfer, illumination should also cause TMPD --> ferredoxin --> QP electron transfer and the subsequent state 1 --> state 2 transition, i.e., redistribution of the energy of electron excitation favoring Photosystem I. This is expected to result in gradual acceleration of light-dependent O2 uptake. However, no such effect actually occurred (Fig. 5d).
The part of the electron transfer chain at the level of plastocyanin and/or cytochrome c6, which provides for electron transfer from cytochrome f to the P700 reaction center of Photosystem I, is likely to be responsible for the transition of Photosystem I to the noncyclic mode of operation characterized by the maximum turnover number. Plant plastocyanin (reviewed in [46, 47]) is an acidic protein with a negative net charge. It contains a positively charged site and also a negatively charged site. Plastocyanin electrostatically interacts with its partners in the electron transfer chain. The positively charged site is used to react with the Photosystem I complex; the negatively charged site enables it to interact with cytochrome f. Cyanobacterial plastocyanin is less acidic than plant plastocyanin, but the primary structure of these two proteins is similar: they contain the same conservative amino acid residues. Like plant plastocyanin, cyanobacterial plastocyanin electrostatically interacts with its reaction partners [47-49]. While plastocyanin is a copper-containing, beta-folded protein, cytochrome c6 (synthesized by copper-deficient cyanobacteria and by a number of green algae) is a heme-containing protein with alpha-helix. Algal cytochrome c6 uses its negatively charged site to interact with the positive charge on the Photosystem I complex [50]. Cyanobacterial cytochrome c6 also has such a negatively charged site [50]. In Chlamydomonas reinhardtii, plastocyanin and cytochrome c6 reduce P700+ with the same half-time (3 µsec) and with first-order kinetics [51]. Tyrosine-83 of plastocyanin and tryptophane-63 of algal cytochrome c6 are isofunctional in terms of their interaction with cytochrome f [52].
The electrostatic nature of plastocyanin--Photosystem I interaction is suggested by data on the stimulation of P700+ reduction upon neutralization of the negatively charged sites of the redox partners by adding divalent cations or lowering the pH value (see [46] for a review). Neutralization of the negative surface charge of the membrane decreases the duration of the lag phase and accelerates O2 evolution by A. variabilis cells [1]. Mono-, di-, and trivalent cations reduce the lag phase and increase the rate of O2 evolution. Their optimal concentrations change by an order of magnitude in the Na+, K+ > Mg2+, Ca2+ > La3+ sequence [1]. Gramicidin D and the valinomycin--nigericin combination, which dissipate the proton-motive force (Deltap) across thylakoid membranes, prolong the lag phase [1] and decrease the rate of O2 evolution [5], i.e., Deltap generation produces the same effect as metal cations.
DeltapH is the main component of Deltap across the thylakoid membranes of higher plants, algae, and cyanobacteria. Its magnitude is 3 units or more. If the pH value of the chloroplast stroma or cyanobacterial cytoplasm is 7, then the intrathylakoid pH value is 4 or less. Protonation reactions can undoubtedly change the acid--base properties of proteins completely or partially located on the inner surface of thylakoid membranes. Such proteins include plastocyanin (cytochrome c6) and the sites on its redox partners (cytochrome f and Photosystem I complex) serving for their interaction with plastocyanin (cytochrome c6).
Hence, light-induced Deltap formation, which promotes optimization of the plastocyanin-mediated interaction of the b6f complex and Photosystem I, seems to be the main factor accounting for the gradual increase in the rate of CO2-dependent O2 evolution during the initial period of illumination. The relevant part of the photosynthetic electron transfer chain can be considered an autocatalytic system whose optimal mode of operation is adjusted by Deltap.
Based on data on the reduction of P700 after switching off light, reduced plastocyanin binds to Photosystem I 5-7 times more tightly than oxidized plastocyanin [54]. Therefore, the increase in the level of plastocyanin reduction under illumination should also help the system to overcome the lag phase during photosynthetic O2 evolution.
In summary, our results suggests that the lag phase during photosynthetic O2 evolution results from the acceleration of cell respiration during the initial period of illumination due to the replenishment of the reduced plastoquinone pool (accounting for O2 uptake), overridden by equimolar O2 evolution linked to electron transfer from H2O to plastoquinone (involving Photosystem II) and subsequent deceleration of respiration due to the transition of the electron transfer system to the competitive mode of action involving Photosystem I.
This work was supported by a grant from the Russian Foundation for Basic Research (No. 98-04-48226).
REFERENCES
1.Barsky, E. L., Gusev, M. V., Kazennova, N. V., and
Samuilov, V. D. (1984) Arch. Microbiol., 138, 54-57.
2.Takahama, U., Shimizu-Takahama, M., and Heber, U.
(1981) Biochim. Biophys. Acta, 637, 530-539.
3.Allen, J. F. (1984) FEBS Lett., 166,
237-244.
4.Laisk, A., Siebke, K., Gerst, U., Eichelmann, H.,
Oja, V., and Heber, U. (1991) Planta, 185, 554-562.
5.Barskii, E. L., Gusev, M. V., Kazennova, N. V., and
Samuilov, V. D. (1985) Fiziol. Rast., 32, 688-694.
6.Kaplan, A., Volokita, M., Zenvirth, D., and
Reinhold, L. (1984) FEBS Lett., 176, 166-168.
7.Espie, G. S., and Kandasamy, R. A. (1994) Plant
Physiol., 104, 1419-1428.
8.Markarova, E. N., Saari, L. A., Beshta, O. E., and
Gusev, M. V. (1996) Mikrobiologiya, 65, 818-823.
9.Ritchie, R. J., Nadolny, C., and Larkum, A. W. D.
(1996) Plant Physiol., 112, 1573-1584.
10.Blubaugh, D. J., and Govindjee (1986) Biochim.
Biophys. Acta, 848, 147-151.
11.Van Rensen, J. J. S., Tonk, W. J. M., and De
Bruijn, S. M. (1988) FEBS Lett., 226, 347-351.
12.Miller, A. G., Espie, G. S., and Canvin, D. T.
(1991) Can. J. Bot., 69, 1151-1160.
13.Ritchie, R. J. (1992) Plant, Cell and
Environment, 15, 163-177.
14.Debus, R. J. (1992) Biochim. Biophys.
Acta, 1102, 269-352.
15.Samuilov, V. D., Renger, G., Paschenko, V. Z.,
Oleskin, A. V., Gusev, M. V., Gubanova, O. N., Vasil'ev, S. S., and
Barsky, E. L. (1995) Photosynth. Res., 46, 455-465.
16.Samuilov, V. D., Barsky, E. L., Gubanova, O. N.,
Klimov, V. V., and Kozlov, Yu. N. (1995) FEBS Lett., 357,
55-57.
17.Vinogradov, A. D. (1998) Biochim. Biophys.
Acta, 1364, 169-185.
18.Peschek, G. A. (1996) Biochim. Biophys.
Acta, 1275, 27-32.
19.Manna, P., and Vermaas, W. (1997) Plant Mol.
Biol., 35, 407-416.
20.Sandmann, G., and Malkin, R. (1983) Biochim.
Biophys. Acta, 725, 221-224.
21.Binder, A., Hauser, R., and Krogmann, D. (1984)
Biochim. Biophys. Acta, 765, 241-246.
22.Matthijs, H. C. P., Luderus, E. M. E.,
Löffler, H. J. M., Scholts, M. J. C., and Kraayenhof, R. (1984)
Biochim. Biophys. Acta, 766, 29-37.
23.Abdourashitova, F. D., Barsky, E. L., Gusev, M.
V., and Samuilov, V. D. (1985) Planta, 166, 182-186.
24.Bader, K. P., and Schmid, G. H. (1989)
Biochim. Biophys. Acta, 974, 303-310.
25.Bennoun, P. (1982) Proc. Natl. Acad. Sci.
USA, 79, 4352-4356.
26.Peltier, G., Ravenel, J., and Vermeglio, A.
(1987) Biochim. Biophys. Acta, 893, 83-90.
27.Garab, G., Lajko, F., Mustardy, L., and Marton,
L. (1989) Planta, 179, 349-358.
28.Gruszecki, W. I., Bader, K. P., and Schmid, G. H.
(1994) Biochim. Biophys. Acta, 1188, 335-338.
29.Corneille, S., Cournac, L., Guedeney, G., Havaux,
M., and Peltier, G. (1998) Biochim. Biophys. Acta, 1363,
59-69.
30.Matsubayashi, T., Wakasugi, T., Shinozaki, K.,
Yamaguchi-Shinozaki, K., Zaita, N., Hidaka, T., Meng, B. Y., Ohto, C.,
Tanaka, M., Kato, A., Maruyama, T., and Sugiura, M. (1987) Mol. Gen.
Genet., 210, 385-393.
31.Thornber, J. P. (1969) Biochim. Biophys.
Acta, 172, 230-241.
32.Whittingham, C. P. (1952) Nature,
169, 838-839.
33.Wishnick, M., and Lane, M. D. (1969) J. Biol.
Chem., 244, 55-59.
34.Bishop, N. I., and Spikes, J. D. (1955)
Nature, 176, 307-308.
35.Ouitrakul, R., and Izawa, S. (1973) Biochim.
Biophys. Acta, 305, 105-118.
36.Takahashi, M., and Asada, K. (1976) Eur. J.
Biochem., 64, 445-452.
37.Packham, N. K., Mansfield, R. W., and Barber, J.
(1982) Biochim. Biophys. Acta, 681, 538-541.
38.Fujii, T., Yokoyama, E., Inoue, K., and Sakurai,
H. (1990) Biochim. Biophys. Acta, 1015, 41-48.
39.Williams, W. P., and Allen, J. F. (1986)
Photosynth. Res., 13, 19-45.
40.Vener, A. V., Van Kan, P. J. M., Rich, P. R.,
Ohad, I., and Andersson, B. (1997) Proc. Natl. Acad. Sci. USA,
94, 1585-1590.
41.Harrison, M. A., Tsinoremas, N. F., and Allen, J.
F. (1991) FEBS Lett., 282, 295-299.
42.Mullineaux, C. W., and Allen, J. F. (1986)
FEBS Lett., 205, 155-160.
43.Williams, W. P., and Dominy, P. J. (1990)
Biochim. Biophys. Acta, 1015, 121-130.
44.Prince, R. C., Linkletter, S. J. G., and Dutton,
P. L. (1981) Biochim. Biophys. Acta, 635, 132-148.
45.Rich, P. R. (1984) Biochim. Biophys. Acta,
768, 53-79.
46.Gross, E. L. (1993) Photosynth. Res.,
37, 103-116.
47.Morand, L. Z., Cheng, R. H., Krogmann, D. W., and
Ho, K. K. (1994) in The Molecular Biology of Cyanobacteria
(Bryant, D. A., ed.) Kluwer, Dordrecht, pp. 381-407.
48.Wagner, M. J., Packer, J. C. L., Howe, C. J., and
Bendall, D. S. (1996) Biochim. Biophys. Acta, 1276,
246-252.
49.Hippler, M., Reichert, J., Sutter, M., Zak, E.,
Altschmied, L., Schröer, U., Herrmann, R., and Haehnel, W. (1996)
EMBO J., 15, 6374-6384.
50.Beissinger, M., Sticht, H., Sutter, M., Ejchart,
A., Haehnel, W., and Rösch, P. (1998) EMBO J., 17,
27-36.
51.Hippler, M., Drepper, F., Farah, J., and Rochaix,
J. D. (1997) Biochemistry, 36, 6343-6349.
52.Ullmann, G. M., Hauswald, M., Jensen, A., Kostic,
N. M., and Knapp, E. W. (1997) Biochemistry, 36,
16187-16196.
53.Ostroumov, S. A., Jasaitis, A. A., and Samuilov,
V. D. (1979) in Biomembranes, Vol. 10 (Manson, L. A., ed.)
Plenum Press, New York, pp. 209-233.
54.Drepper, F., Hippler, M., and Haehnel, W. (1995)
in Photosynthesis: from Light to Biosphere (Mathis, P., ed.)
Vol. II, Kluwer, The Netherlands, pp. 697-700.
