REVIEW: Local Structure and Dynamics in Proteins Characterized by Hydrogen Exchange and Mass Spectrometry
D. L. Smith
Department of Chemistry, University of Nebraska-Lincoln, Lincoln, NE 68588-0304, USA; fax: 402-472-9862; E-mail: DLS@UNLINFO.UNL.EDU
 D. L. Smith |
Received July 16, 1997
Amide hydrogen exchange rates, determined by NMR spectroscopy, have become an important tool that is often used to investigate structure and dynamics of small proteins. Recent developments in mass spectrometry and sample handling methods make possible measurement of deuterium levels at peptide amide linkages in polypeptides. The ability to make these measurements has led to development of the protein fragmentation/mass spectrometry approach for determining amide hydrogen exchange rates in short segments of intact proteins following their incubation in D2O. Partially deuterated proteins are proteolytically fragmented into peptides whose molecular weights are determined by on-line liquid chromatography/mass spectrometry. Deuterium levels, which are determined from the molecular weights of the peptic fragments, can be used to determine amide hydrogen exchange rates. Details of the protein fragmentation/mass spectrometry approach, along with a brief review of the theory of amide hydrogen exchange, are described. The ability to detect and locate minor structural differences in proteins by the protein fragmentation/mass spectrometry approach is illustrated using oxidized and reduced cytochrome c. These results show that oxidation of iron has little effect on the N- and C-terminal regions, but significantly destabilizes the interior regions of cytochrome c. The ability to detect localized unfolding in large proteins is illustrated with aldolase that was equilibrated in acid. Despite the success achieved by NMR spectroscopy for determining amide hydrogen exchange rates, mass spectrometry is advantageous because it permits studies of large proteins, requires only picomoles of protein, and provides a direct measure of structural heterogeneity. KEY WORDS: mass spectrometry, hydrogen exchange, protein structure, protein dynamics, cytochrome c, aldolase, electrospray ionization
|
Abbreviations: ESIMS) electrospray ionization mass spectrometry; HPLC) high performance liquid chromatography; MALDI) matrix assisted laser desorption ionization; MS) mass spectrometry; NMR) nuclear magnetic resonance.
Introduction of two new ionization methods, electrospray ionization (ESI) and matrix assisted laser desorption ionization (MALDI), have dramatically advanced the role mass spectrometry plays in identifying proteins by their primary structure. When coupled with the appropriate mass analyzers, ESI and MALDI have facilitated major advances in the accuracy with which the molecular weights of proteins can be determined, the ability to analyze mixtures of proteins with similar molecular weights, the molecular weight range accessible to measurement, and the minimum quantity of protein required for analysis. For example, the molecular weights of proteins are routinely determined with an uncertainty of less than 0.01%, and signals for proteins whose molecular weights differ by only 0.1% can be resolved by common mass analyzers. Although several picomoles of protein are often required for analysis, new sample handling techniques are poised to decrease the minimum sample required to the sub-femtomole level. These advances in performance have propelled mass spectrometry into the forefront of methods for identifying proteins by their molecular weights and for identifying posttranslational modifications. The power of this approach is advanced even further when these ionization methods are used to identify proteolytic fragments of proteins.
Electrospray ionization has also been used to investigate the non-covalent structures of proteins. Although proteins are usually sampled from acidic solutions that cause denaturation, it is often possible to sample proteins from neutral solutions. Under these conditions, two remarkable observations have been reported. Chowdhury et al. reported that the charge state distribution of cytochrome c changed with the pH of the solution [1]. Their results were consistent with the notion that the charge state found by mass spectrometry was related to the charge state of the protein in solution [1]. This relationship opened the possibility for using charge state distributions, as detected by ESIMS, to distinguish between folded and unfolded proteins. The other remarkable observation involved detection of protein--ligand complexes joined only by non-covalent forces [2]. The ability to maintain intact non-covalent complexes during ESIMS analysis has been used in numerous studies to determine the stoichiometry of subunits comprising these complexes. The history and application of these methods for examining the non-covalent structures of proteins have been reviewed [3, 4].
The rates at which amide hydrogens undergo isotopic exchange have also been used to probe non-covalent structures of proteins. Amide hydrogen exchange rates, which are very sensitive to hydrogen bonding, are relatively fast in peptides with random structure where there are few intramolecular hydrogen bonds and the amide hydrogens are exposed to the solvent. However, amide hydrogen exchange rates in folded proteins may be slower by 108 because the high-order structure of folded proteins requires a complex network of intramolecular hydrogen bonds, and because the folded structure limits the exposure many regions have to the solvent. Conventional methods used to determine amide hydrogen exchange rates in proteins include tritium exchange [5], infrared spectroscopy [6], ultraviolet spectroscopy [7], and NMR [8]. Examples of recent applications using multi-dimensional NMR include studies of protein--ligand binding [9-13], protein folding and unfolding [14-17], and functional variants [18, 19].
Mass spectrometry has extended the power of amide hydrogen exchange for probing protein structure and dynamics. Initial studies by Thévenon [20, 21] demonstrated that amide hydrogen exchange rates could be measured by mass spectrometry, while studies by Katta et al. demonstrated folded and unfolded ubiquitin could be detected by their different hydrogen exchange rates [22]. Results of numerous studies in which hydrogen exchange and mass spectrometry of the intact polypeptide were used to examine structural and dynamic features have been reported [12, 23, 24]. The combination of mass spectrometry and hydrogen exchange has been extended to include proteolytic fragmentation of partially labeled proteins, enabling determination of deuterium levels in specific regions of proteins [25-29]. The fundamental basis of this method, as well as examples illustrating types of structural information that can be derived from these measurements, will be described in this paper.
PROTEIN FRAGMENTATION/MS APPROACH FOR DETERMINING AMIDE HYDROGEN
EXCHANGE RATES
Exchangeable hydrogens located on amino acid side chains, as well as those on the N- or C-terminus exchange too rapidly to be measured by most techniques. As a result only hydrogens located on peptide amide linkages, which have exchange rates in the range that can be measured readily, are most useful as sensors for structural changes. Amide hydrogens located at peptide linkages are particularly useful as structural probes because they form a continuous string of sensors extending the entire length of a polypeptide chain.
Isotopic exchange of peptide amide hydrogens may be catalyzed by acid or base. Hence, the rate constant for hydrogen exchange, kex can be expressed as the sum of two terms, as indicated in Eq. (1):
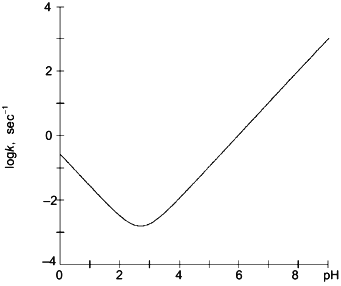
Although the side chains of amino acids adjacent to peptide amide linkages may alter amide hydrogen exchange rates by as much as 10-fold [30], secondary and tertiary structural features of folded proteins may decrease amide hydrogen exchange rates by as much as 108. This large reduction in isotopic exchange rates facilitates use of amide hydrogen exchange as a sensitive probe for detecting and locating conformational changes in proteins.Fig. 1. The rate constant for isotopic exchange of hydrogen located on peptide amide linkages in polyalanine presented as a function of pH. Results were calculated using Eq. (1) and values of kH and kOH given in the text [30].
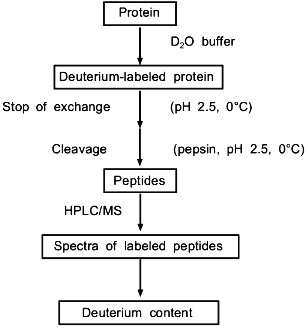
Combined proteolytic fragmentation/mass spectrometry is relatively new [25], but the general approach can be traced to studies reported much earlier by Richards and colleagues [31, 32]. Fundamental aspects of the method were subsequently described by Englander et al. [33]. The general procedure used in the protein fragmentation/MS approach for determining amide hydrogen exchange rates in intact proteins is illustrated in Fig. 2. Isotopic exchange occurs while the folded protein is incubated in D2O buffered to the desired pD. Following the deuterium exchange-in step, isotopic exchange at peptide amide linkages is quenched by decreasing the pD to 2.5 and the temperature to 0°C. Note that the exchange rate decreases tenfold for each pH unit (Fig. 1), and that isotopic exchange in unfolded polypeptides is slowest for pH 2-3. In addition, decreasing the temperature from 20 to 0°C lowers the exchange rate by an additional tenfold. For these quench conditions, the half-life for isotopic exchange at peptide amide linkages is 30-120 min [30]. Isotopic analysis should be completed within several minutes to minimize artifactual isotopic exchange.
To determine isotopic exchange rates within small, defined regions of a protein, the acid protease pepsin is used to fragment the protein into peptides. Pepsin is ideal for this purpose because it has maximum activity at pH 2-3 where the amide hydrogen exchange rate is slowest. Given the power of mass spectrometry for identifying peptides in complex mixtures, the low specificity of pepsin is advantageous because it usually gives many peptides, which can be easily identified in preliminary measurements. For example, with standard quench conditions (0°C, pH 2.5), a 5 min peptic digestion of aldolase, a relatively large protein with 363 residues, gave over 100 peptides [29]. A 64-peptide subset could be related back to 84% of the aldolase backbone. The average segment length in this subset was 13 peptide linkages, with the shortest and longest segments spanning 3 and 26 linkages, respectively. When the spatial resolution was increased by analyzing the difference in deuterium levels in overlapping peptides, the effective average segment length was 5 linkages.Fig. 2. Procedure used to determine deuterium levels at peptide amide linkages in short segments of intact proteins incubated in D2O [25].
Since isotopic quench conditions must be maintained during digestion, a large amount of pepsin (substrate/enzyme ratio of 1:1) is used to reduce the required digestion time to <10 min. The peptic digest is analyzed by directly-coupled HPLC MS to determine the molecular weights of the peptic fragments, from which the levels of deuterium present in the corresponding segments of the protein are determined. The peptides are separated from the buffer salts and fractionated by their hydrophobicity in the chromatographic step. Since a protiated mobile phase is used for HPLC, deuterium located at rapidly exchanging sites, such as on the side-chains or on the N- and C-termini of the peptides, are replaced with protium before reaching the mass spectrometer. Hence, the increase in molecular weight is due to deuterium located at peptide amide linkages. Although a recent study [30] using model peptides confirms that the back-exchange step works as predicted [33], this study also suggests that the NdeltaH deuterium in the side chain of arginine may not be completely replaced with protium for some conditions. It is also important to note that the HPLC step is complete within 4-7 min.
INTERPRETATION OF HYDROGEN EXCHANGE RESULTS
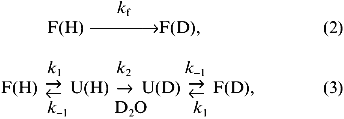
The deuterium levels found in peptides following incubation of the intact protein in D2O for various times can be translated into a phenomenological isotopic exchange rate constant, kex. Various kinetic models have been developed to describe amide hydrogen exchange in folded proteins [34-38]. Most of the results for amide hydrogen exchange in folded proteins can be explained through a two-process model, as illustrated in Eqs. (2) and (3):
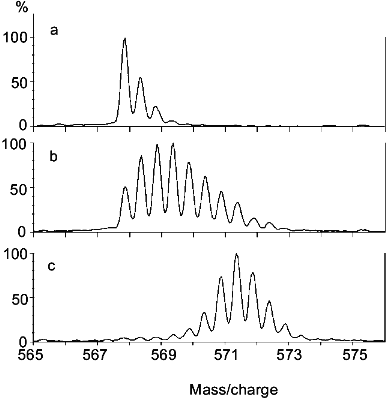
The ESI mass spectrum for the molecular ion of the segment including peptide linkages 327-336 of rabbit muscle aldolase following incubation in D2O and proteolytic fragmentation is presented in Fig. 3. Results are presented for aldolase that had been incubated in D2O for 0 min (Fig. 3a), aldolase that had been incubated in D2O for 0.5 h (Fig. 3b), and aldolase that had all exchangeable hydrogens replaced with deuterium (Fig. 3c). The deuterium levels in this segment were determined from the difference between the average molecular weights of these peptides and the average molecular weight calculated for this peptide if it had the natural abundance of isotopes. Note that 0.2 mole of deuterium were found in this segment when derived from aldolase that initially had no deuterium (Fig. 3a). This level of deuterium was due to isotopic exchange (deuterium exchange-in) occurring during the 5 min digestion, which was performed in an aqueous solution that was 90% D2O. When this segment was derived from completely deuterated aldolase (Fig. 3c), it had 7.6 moles of deuterium. Since this segment has 9 peptide linkages, 2.4 moles of deuterium were apparently lost during analysis. Hence, analysis of completely labeled aldolase provides a quantitative measure of deuterium loss occurring during the digestion and HPLC steps. A procedure for quantitatively adjusting for these losses has been described [25].
Two important types of information may be derived from the type of mass spectra presented in Fig. 3: 1) the average molecular weight of the peptides, and 2) the intermolecular distribution of deuterium in this segment. The average molecular weight of the peptides gives the number of deuterium located at peptide amide linkages from which the distribution of hydrogen exchange rates within a segment can be estimated. The intermolecular distribution of deuterium can be determined from the isotope pattern in the mass spectrum. If deuterium is randomly distributed among the entire population of molecules comprising a particular peptide, the intensity of isotope peaks can be described by expanding the appropriate binomial function [39, 40]. The isotope patterns of the three spectra depicted in Fig. 3 are consistent with a random distribution of deuterium, indicating a high level of structural homogeneity in this region of aldolase during the deuterium exchange-in time. A random distribution of deuterium is expected when hydrogen exchange occurs in the folded form of a protein (Eq. (2)) or via the unfolded form (Eq. (3)) when k-1 >> k2. Experimental methods for distinguishing between these two mechanisms for hydrogen exchange have been described [41].Fig. 3. The molecular ion {(M + 2H)2+} region of the ESI mass spectrum of the peptide fragment of aldolase including peptide linkages 327-336 derived from nondeuterated (a), partially deuterated (b), and completely deuterated (c) rabbit muscle aldolase (adapted from [51]). Level of deuterium (in moles) equals 0.2 (a), 2.6 (b), and 7.6 (c).
Hydrogen exchange involving protein unfolding (Eq. (3)) is of special importance because it provides a direct measure of the rates of protein unfolding (k1) and refolding (k-1), as well as a link to the free energy change accompanying protein folding. For most proteins at neutral pH and in the absence of denaturants, k-1 >> k2 and the phenomenological rate constant for isotopic exchange is given by Eq. (4):
Under some destabilizing conditions (e.g., addition of denaturants, extreme pH, high temperature) k2 >> k-1 and the measured isotope exchange rate constant, kex, may be used to determine the rate or protein unfolding, k1 ([44], Y. Deng and D. L. Smith, unpublished data):
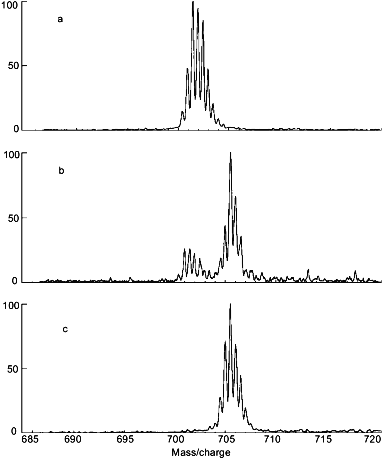
Use of the intermolecular distribution of deuterium to detect structural heterogeneity in a protein can be illustrated with rabbit muscle aldolase that was destabilized by acid. The protein was dissolved in D2O at pD 6.52 for 0.021 h, 4.04 for 6.29 h, or 3.00 for 56 h. The incubation times were selected to compensate for the fact that k2 also depends on pD (see Fig. 1). Details of the general approach used to relate changes in the equilibrium constant describing the distribution of folded and unfolded forms of a protein (Eqs. (3) and (4)) to amide hydrogen exchange results are discussed elsewhere [28]. Mass spectra obtained for the segment including residues 257-269 derived from the intact protein are given in Fig. 4 (a-c). Doubly charged ions would be found at m/z 700.9 if this segment had no deuterium. The multiple peaks in Fig. 4a are separated by 0.5 m/z units, as expected for doubly charged ions with various numbers of 13C and deuterium. The molecular weight of this segment, averaged over all molecules in the sample, was determined from the centroid of the isotope peaks. After adjustment for the artifactual gain in deuterium during digestion, the deuterium level in this segment was found to be less than 0.2 mole. The low level of deuterium in this segment following incubation of aldolase in D2O for 0.021 h is consistent with results of Zhang et al. [29], who reported that the amide hydrogens in this region have isotopic exchange rate constants of less than 0.002 h-1. The low rate of hydrogen exchange shows that the region including residues 257-269 of aldolase remained tightly folded during the 0.021 h that the intact protein was incubated in D2O.
When adjusted for the gain and loss of deuterium during analysis, the centroid of the isotope pattern in Fig. 4c indicates that the amide hydrogens at all 10 peptide linkages in the 257-269 segment are completely deuterated following incubation of intact aldolase in D2O at pD 3.00. The dramatic increase (0 to 100%) in deuteration in this segment as the pD was decreased from 6.52 to 3.00 is attributable only to acid-induced unfolding of aldolase because the incubation time was increased to quantitatively compensate for the decrease in k2 with pD [30]. This high rate of hydrogen exchange is due to little or no secondary or tertiary structure in aldolase at pD 3.00.Fig. 4. Electrospray ionization mass spectra of the doubly-charged molecular ion of the peptide derived from the 257-269 segment of aldolase following incubation of the intact protein in D2O at pD 6.52 (a), 4.04 (b), and 3.00 (c) (adapted from [51]).
The bimodal isotope pattern obtained for the 257-269 segment of aldolase following incubation of the intact protein at the intermediate pD of 4.04 (Fig. 4b) is of particular interest to understanding processes associated with acid denaturing because it shows that hydrogen exchange has been very slow in this segment of some aldolase molecules and very fast in others. The area of the low-mass envelope of isotope peaks indicates the fraction of aldolase molecules that were folded during the incubation time, while the area of the high-mass envelope of isotope peaks indicates the fraction of molecules that were unfolded during the incubation period. Comparison of the relative areas of the peaks in the two envelopes at pD 4.04 indicates that 78% of the aldolase molecules were unfolded in the region including residues 257-269. These results demonstrate that bimodal isotope patterns obtained with the protein fragmentation/MS method can be used to determine the pH at which proteins become unstable. Results of exploratory studies in this area suggest that isotope patterns may be useful for a wide variety of protein structural and dynamical studies.
APPLICATION TO OXIDIZED/REDUCED CYTOCHROME c
The oxidized and reduced forms of cytochrome c illustrate how very minor changes in conformation may be detected and located by amide hydrogen exchange. Many studies of cytochrome c have sought to link structural differences in its oxidized and reduced forms to its ability to accept and donate an electron. Specifically, how do the relative positions of the approximately 104 amino acid residues present in most cytochromes c differ in the oxidized and reduced forms? The functional difference in the two forms is the oxidation state, Fe (III) or Fe (II), of the lone iron coordinated to the heme. Stability measurements performed using several different experimental methods indicate that the reduced form is several kcal/mole more stable than the oxidized form.
High resolution X-ray diffraction [45, 46] and NMR [47] have been used to determine the structural differences between oxidized and reduced cytochrome c. X-Ray diffraction studies showed that the heme moves out of the pocket by 0.15 Å and that one of three water molecules moves 1 Å closer to the heme upon oxidation of the iron. The root-mean-square difference in corresponding atomic positions of oxidized cytochrome c and reduced cytochrome c is only 0.5 Å, indicating that oxidized and reduced cytochrome c have very similar structures. Despite the structural similarities of oxidized and reduced cytochrome c, hydrogen exchange rates at some peptide linkages, measured by high resolution NMR, are very different for oxidized and reduced cytochrome c [48, 49]. The protein fragmentation/MS approach for determining amide hydrogen exchange rates has also been used to detect and locate the minor structural changes known to differentiate the oxidized and reduced forms of cytochrome c [50].
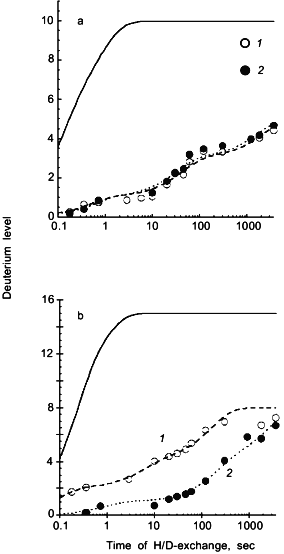
Deuterium levels in 8 peptides spanning the entire 104 residue backbone of cytochrome c were determined for oxidized or reduced cytochrome c incubated in D2O for 0.2 sec to 60 min. Since rate constants for amide hydrogen exchange at neutral pH span a range from fractions of a second to months, this exchange-in time is suitable for determining rate constants for only the most rapidly exchanging amide hydrogens. Longer exchange times would be required to determine the isotope exchange rates of the more slowly exchanging amide hydrogens. Deuterium levels found in two segments, including amide linkages of residues 1-10 and 66-82 are presented in Fig. 5 as a function of the time the intact proteins were incubated in D2O. The solid line in each figure shows the deuterium levels these segments would have if the protein were completely unfolded, exposing the amide hydrogens to the aqueous solvent for the temperature and pH used in the present study [30]. Differences between the deuterium levels calculated for unfolded segments and those measured for the same but folded segments, indicate the extent to which amide hydrogen exchange rates were diminished by the secondary and tertiary structure of the native protein.
Results in Fig. 5a show the deuterium level in the segment including amide linkages 1-10 increasing to 5 when either oxidized or reduced cytochrome c was incubated in D2O for 60 min. Fitting these data to a series of exponential functions [29, 51] indicates that one amide hydrogen in this segment has an isotope exchange rate constant of 2 sec-1, two have rate constants of 0.02-0.03 sec-1, and two have rate constants of 0.0005-0.0006 sec-1. The remaining five peptide amide hydrogens in this segment have exchange rate constants less than 0.0001 sec-1. Results for three other segments including residues 11-21, 82-94, and 96-104 indicate a similarly wide range of isotope exchange rates. Although hydrogen exchange rates are different in each segment, they are independent of whether cytochrome c was in the oxidized or reduced form. Since no difference in the amide hydrogen exchange rates in regions including peptide linkages 1-21 and 82-104 was detected, these results suggest that the oxidation state of iron has little effect on the cytochrome c structure in these regions.Fig. 5. Deuterium levels in segments including residues 1-10 (a) and 66-82 (b) derived from oxidized (1) and reduced (2) cytochrome c following incubation of the intact protein in D2O. The solid line indicates the deuterium levels that are expected in these segments if there were no secondary or tertiary structure [30]; the dashed lines indicate the fitting of first-order rate constants to the experimental data. A flow-quench system [52] was used to exchange deuterium into oxidized and reduced cytochrome c for 0.2 to 120 sec, while manual mixing methods were used for longer exchange times of 5-60 min (adapted from [50]).
Deuterium levels found in segment 66-82, derived from the interior of oxidized or reduced cytochrome c, are presented in Fig. 5b. The solid line again indicates the deuterium level expected if the protein were unfolded. It is significant that the deuterium level in this segment is greater when the segment was derived from the oxidized form of cytochrome c, suggesting that the structures of the two forms of the protein differ in this region. Hydrogen exchange was faster in three other segments including residues 23-36, 38-46, and 49-64 when derived from oxidized cytochrome c. From these results, it is evident that the oxidation of iron substantially changes the rates of isotopic exchange at several peptide amide linkages in the interior region of cytochrome c including residues 23-82. The higher levels of deuterium found in these segments, when derived from the oxidized protein, indicate that redox driven structural changes have occurred throughout these regions.
OTHER APPLICATIONS OF PROTEIN FRAGMENTATION/MS
Although introduced only four years ago, considerable progress has been made in delineating the practice and application of the protein fragmentation/MS approach for determining rates of localized hydrogen exchange in proteins. The initial studies [25], as well as others from our laboratory [26, 29, 52], were designed to demonstrate feasibility of the method, identify conditions required to minimize isotope exchange during analysis, and to develop a theoretical framework useful for linking deuterium levels found in peptides to structural features of proteins. These studies have led to a simple procedure used to adjust for artifactual isotope exchange occurring during digestion and HPLC analysis [25], to determine the distribution of isotope exchange rate constants within peptic fragments [29], to calculate bimodal isotope patterns characterizing structural variants [29], and to determine the exchange rates of the most rapidly exchanging amide hydrogens [52]. These studies have also demonstrated that the protein fragmentation/MS approach is useful for structural studies of large proteins, such as aldolase (Mr 157,000) [29] and alpha-crystallin (Mr 500,000) [26], and that amide hydrogen exchange rates in aldolase correlate with intramolecular hydrogen bonding and crystallographic B-factors [29]. We have also used hydrogen exchange to characterize local thermal stability in aldolase [28] and to identify regions in which oxidized and reduced cytochrome c have structural differences [50]. Recent applications by our group include use of rapid, pulsed-labeling techniques to investigate cytochrome c folding (H. H. Yang and D. L. Smith, unpublished data), determination of unfolding rates and thermodynamic stabilities of regions undergoing cooperative unfolding in aldolase incubated in urea (Y. Deng and D. L. Smith, unpublished data), and investigation of Hck SH3 unfolding dynamics when free and bound to various ligands [53].
The protein fragmentation/MS approach has been implemented in at least three additional laboratories which have applied the method to a variety of problems. This approach has been used to show that three regions of apomyoglobin retain structure similar to that of holo-myoglobin, while two other regions are destabilized [54]. Protein fragmentation/MS has also been used to measure amide hydrogen exchange characteristic of mutant forms of cytochrome c2 [55, 56], ferricytochrome c553 [57], and a phosphocarrier protein [27]. This approach has also been used to detect conformational changes induced by ligand binding [58, 60].
CONCLUSIONS
By combining hydrogen exchange with acid proteolysis and on-line HPLC MS (i.e., the protein fragmentation/MS method), it is now possible to determine isotope exchange rates of hydrogens located on peptide amide linkages in short segments of large proteins. The ability to determine exchange rates of hydrogens located at specific peptide linkages by NMR makes it the preferred method for studies of small proteins. Relative to NMR, the protein fragmentation/MS approach is attractive because: 1) structural heterogeneity can be determined from the isotope patterns in the mass spectra of backbone fragments ([29], D. L. Smith et al., unpublished data); 2) amide hydrogens located along the entire backbone, including the most rapidly exchanging peptide amide hydrogens of proteins, can be used to sense structural changes [52]; 3) less than a nanomole of material is required for analysis; and 4) proteins much too large to be analyzed by high resolution NMR can be examined [26, 28, 29].
While mass spectrometry may be used to augment NMR studies of small proteins, mass spectrometry is uniquely suited for hydrogen exchange studies of large proteins.
This work was supported by grant RO1 GM 40384 from the National Institutes of Health and the Nebraska Center for Mass Spectrometry. Contributions by K. Dharmasiri, Y. Deng, and Z. Zhang, whose results have been used to illustrate the protein fragmentation/MS methods described here, are gratefully acknowledged.
REFERENCES
1.Chowdhury, S. K., Katta, V., and Chait, B. T.
(1990) J. Am. Chem. Soc., 112, 9012-9013.
2.Ganem, B., Li, Y. T., and Henion, J. D. (1991)
J. Am. Chem. Soc., 113, 6294-6296.
3.Smith, D. L., and Zhang, Z. (1994) Mass
Spectrom. Rev., 13, 411-429.
4.Loo, J. A. (1997) Mass Spectrom. Rev., in
press.
5.Englander, S. W., Downer, N. W., and Teitelbaum, H.
(1972) Annu. Rev. Biochem., 41, 903-924.
6.Osborne, H. B., and Nabedryk-Viala, E. (1982)
Meth. Enzymol., 88, 676-680.
7.Englander, J. J., Calhoun, D. B., and Englander, S.
W. (1979) Analyt. Biochem., 95, 517-524.
8.Wüthrich, K. (1986) NMR of Proteins and
Nucleic Acids, Wiley, New York.
9.Paterson, Y., Englander, S. W., and Roder, H.
(1990) Science, 249, 755-759.
10.Spera, S., Ikura, M., and Bax, A. (1991) J.
Biomol. NMR, 1, 155-165.
11.Loh, S. N., Prehoda, K. E., Wang, J., and
Markley, J. L. (1993) Biochemistry, 32, 11022-11028.
12.Kragelund, B. B., Knudsen, J., and Poulsen, F. M.
(1995) J. Mol. Biol., 250, 695-706.
13.Benjamin, D. C., Williams, D. C., Poljak, R. J.,
and Rule, G. S. (1996) J. Mol. Biol., 257, 866-876.
14.Frieden, C., Hoeltzli, S. D., and Ropson, I. J.
(1993) Protein Sci., 2, 2007-2014.
15.Woodward, C. K. (1994) Current Biology,
4, 112-116.
16.Hooke, S. D., Radford, S. E., and Dobson, C. M.
(1994) Biochemistry, 33, 5867-5876.
17.Bai, Y., Sosnick, T. R., Mayne, L., and
Englander, S. W. (1995) Science, 269, 192-197.
18.Jeng, M. F., and Dyson, H. J. (1995)
Biochemistry, 34, 611-619.
19.Lyons, T. A., Ratnaswamy, G., and Pochapsky, T.
C. (1996) Protein Sci., 5, 627-639.
20.Thévenon-Emeric, G., and Smith, D. L. (1991)
Proc. 39th Conf. Mass Spectrom. Allied Topics, Nashville, TN,
pp. 1436-1437.
21.Thévenon-Emeric, G., Kozlowski, J., Zhang,
Z., and Smith, D. L. (1992) Anal. Chem., 64,
2456-2458.
22.Katta, V., and Chait, B. T. (1991) Rapid
Commun. Mass Spectrom., 5, 214-217.
23.Miranker, A., Robinson, C. V., Radford, S. E.,
and Dobson, C. M. (1996) FASEB J., 10, 93-101.
24.Anderegg, R. J., and Wagner, D. S. (1995) J.
Am. Chem. Soc., 117, 1374-1377.
25.Zhang, Z., and Smith, D. L. (1993) Protein
Sci., 2, 522-531.
26.Liu, Y., and Smith, D. L. (1994) J. Am. Soc.
Mass Spectrom., 5, 19-28.
27.Johnson, R. S. (1996) J. Am. Soc. Mass
Spectrom., 7, 515-521.
28.Zhang, Z., and Smith, D. L. (1996) Protein
Sci., 5, 1282-1289.
29.Zhang, Z., Post, C. B., and Smith, D. L. (1996)
Biochemistry, 35, 779-791.
30.Bai, Y., Milne, J. S., Mayne, L., and Englander,
S. W. (1993) Proteins: Struct. Funct. Genet., 17,
75-86.
31.Rosa, J. J., and Richards, F. M. (1979) J.
Mol. Biol., 133, 399-416.
32.Rosa, J. J., and Richards, F. M. (1981) J.
Mol. Biol., 145, 835-851.
33.Englander, J. J., Rogero, J. R., and Englander,
S. W. (1985) Anal. Biochem., 147, 234-244.
34.Englander, S. W., and Kallenbach, N. R. (1984)
Q. Rev. Biophys., 16, 521-655.
35.Woodward, C., Simon, I., and Tüchsen, E.
(1982) Mol. Cell. Biochem., 48, 135-160.
36.Bai, Y. W., Milne, J. S., Mayne, L., and
Englander, S. W. (1994) Proteins: Struct. Funct. Genet.,
20, 4-14.
37.Kim, K.-S., and Woodward, C. (1993)
Biochemistry, 32, 9609-9613.
38.Miller, D. W., and Dill, K. A. (1995) Protein
Sci., 4, 1860-1873.
39.Yergey, J., Heller, D., Cotter, R. J., and
Fenselau, C. (1983) Anal. Chem., 55, 353-356.
40.McCloskey, J. A. (1990) Meth. Enzymol.,
193, 882-886.
41.Kim, K.-S., Fuchs, J. A., and Woodward, C. K.
(1993) Biochemistry, 32, 9600-9608.
42.Hvidt, A., and Nielsen, S. O. (1966) Adv.
Protein Chem., 21, 287-385.
43.Mayo, S. L., and Baldwin, R. L. (1993)
Science, 262, 873-876.
44.Roder, H., Wagner, G., and Wüthrich, K.
(1985) Biochemistry, 24, 7396-7407.
45.Takano, T., and Dickerson, R. E. (1981) J.
Mol. Biol., 153, 95-115.
46.Berghuis, A. M., and Brayer, G. D. (1992) J.
Mol. Biol., 223, 959-976.
47.Feng, Y., Roder, H., and Englander, S. W. (1990)
Biochemistry, 29, 3494-3504.
48.Wand, A. J., Roder, H., and Englander, S. W.
(1986) Biochemistry, 25, 1107-1114.
49.Marmorino, J. L., Auld, D. S., Betz, S. F.,
Doyle, D. F., Young, G. B., and Pielak, G. J. (1993) Protein
Sci., 2, 1966-1974.
50.Dharmasiri, K., and Smith, D. L. (1997) J. Am.
Soc. Mass Spectrom., in press.
51.Smith, D. L., Deng, Y., and Zhang, Z. (1997)
J. Mass Spectrom., 32, 135-146.
52.Dharmasiri, K., and Smith, D. L. (1996) Anal.
Chem., 68, 2340-2344.
53.Engen, J., Smithgall, T., Gmeiner, W., and Smith,
D. L. (1997) Biochemistry, 36, 14384-14391.
54.Johnson, R. S., and Walsh, K. A. (1994)
Protein Sci., 3, 2411-2418.
55.Jaquinod, M., Halgand, F., Caffrey, M.,
Saint-Pierre, C., Gagnon, J., Fitch, J., Cusanovich, M., and Forest, E.
(1995) Rapid Commun. Mass Spectrom., 9, 1135-1140.
56.Jaquinod, M., Guy, P., Halgand, F., Caffrey, M.,
Fitch, J., Cusanovich, M., and Forest, E. (1996) FEBS Lett.,
380, 44-48.
57.Guy, P., Remigy, H., Jaquinod, M., Bersch, B.,
Blanchard, L., Dolla, A., and Forest, E. (1996) Biochem. Biophys.
Res. Commun., 218, 97-103.
58.Ohguro, H., Palczewski, K., Walsh, K. A., and
Johnson, R. S. (1994) Protein Sci., 3, 2428-2434.
59.Wang, F., Blanchard, J. S., and Tang, X.-J.
(1997) Biochemistry, 36, 3755-3759.
60.Neubert, T. A., Walsh, K. A., Hurley, J. B., and
Johnson, R. S. (1997) Protein Sci., 6, 843-850.
